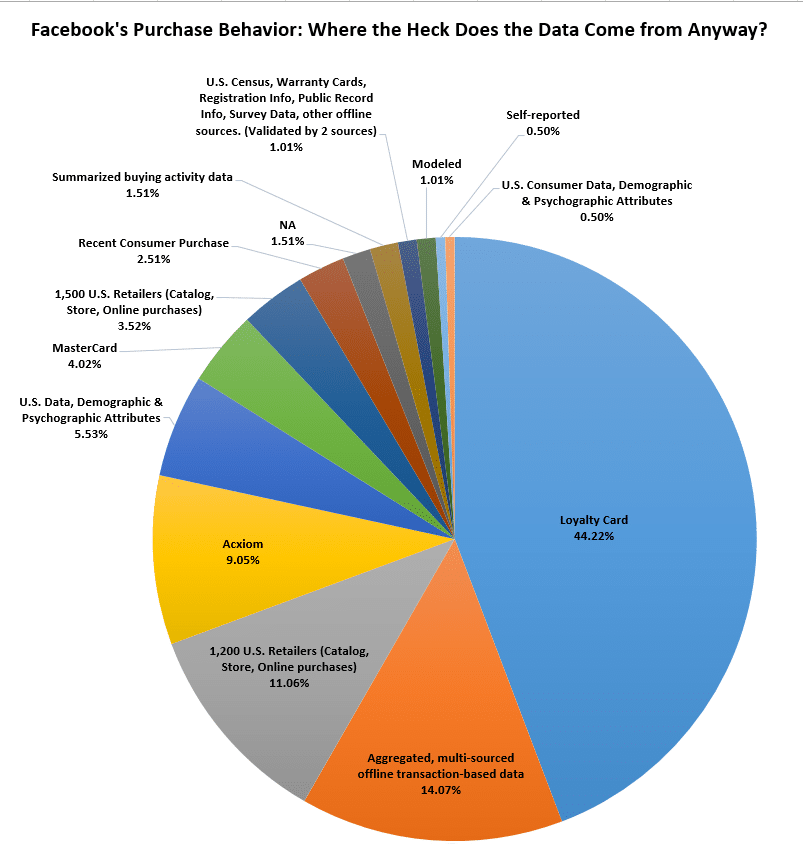
Beyond Page Likes and user generated interests, ever wondered where all of the data within Facebook’s Targeting comes from? We took a deep dive into one of our favorite targeting buckets ” Purchase Behaviors ” to find out where the heck the data comes from. We look to Purchasing Behaviors because they are great ways to easily segment & qualify audiences and, most importantly, it’s data that DOESN’T LIE! Only half of a percent comes from “self reported” data.
As an agency knee-deep in Facebook ads and purchase behavior targeting, it’s essential to understand the source of data used. We dug into the data to understand WHERE the data comes from to aid advertisers in making better targeting decisions. We also wanted to know HOW RELIABLE the sources behind the data really are.

The second largest data mine is collected from the U.S. Census, warranty cards, registration information, the Department of Motor Vehicles, public record information, survey data, and other offline sources. AKA the Feds. It’s important to note: Targetable U.S Data is validated by at least two sources to be included in Facebook’s targeting. An example of who you can reach in this group are dog owners and cat owners.
Loyalty cards are great, but what about credit card data? Yep! Roughly, four percent of Facebook purchasing behaviors are based on anonymous, aggregated transactions data from Mastercard. Check out this quick list of PAST PURCHASES described as, “Individuals that are frequent transactors at”:
- Department stores
- Discount department store
- Appliances & accessories
- Home furnishing and accessories
- Women’s-Luxury retailers
- Restaurant-Fine dining
- Restaurant-Mid-range restaurants/non quick serve
- Restaurant-Quick serve restaurants
Studying Facebook Purchase Behaviors helps us understand how people spend their money within a targeted audience. Below is an AimClear breakdown of Purchase Behavior sources.
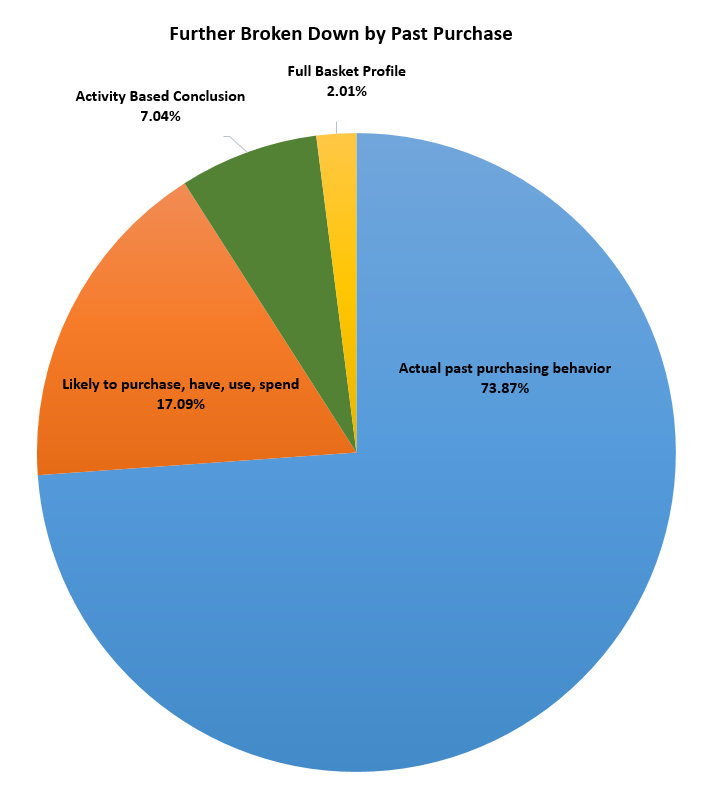
We combined the data sources in the pie chart above into a few categories to help simplify the data. We wanted the answer to, “What percentage of the sources are from past authentic/real/true actions made by the consumers?” versus, “What percentage of the sources are based on conclusions made by algorithms about consumers?” (See chart below.) Nearly 74 percent of purchase behavior data is based on past transactions, while just over 24 percent is based on an algorithm’s calculations. Let that sink in. It’s the keys to the marketing kingdom’s vault and it is full of actual dollars. KA-CHING!
The next time you jump in to set up a campaign, consider the source of the data being targeted. Campaigns using credit card or loyalty card data revealing past transactions have a greater weight than data sources making a mathematical conclusion. It’s worth considering, especially when deciding the value of the audience and budgeting. Targeting with transaction-based data from Mastercard could be worthy of higher spend than an audience with data based on demographics.
Finally, it’s worth noting looking at the sources showed us a handful of targeting groups that didn’t divulge a source. One example is under Behaviors > Purchase Behaviors > Store Types > Luxury Store “the description says, “Consumers who are likely to shop at luxury stores.” How do they know? Our last example is Behaviors > Purchase Behaviors > Buyer profiles > Coupon Users and described as, “Consumers who are likely to use coupons.” Where does this data come from to prove that these consumers are clippin’ coups?
Happy Targeting 🙂


