photo credit: B Rosen
We’ve reviewed plenty of paid search accounts, where the supposed PPC expert literally destroyed a business. We know it’s difficult for non PPC professionals to vet vendors, giving the ever shifting best-practices landscape. It’s no wonder there’s an icky underbelly to the PPC vendor scene. Things change very quickly so it’s hard for anyone but the most committed practitioners to keep up.
For wary CMOs and marketing managers wondering how to screen their AdWords account for obvious weaknesses, this post offers guerrilla protocol for a 30,000 foot PPC vendor gut check. Use it to check whether experts are cool or jacking you around.
We mean it to be easily understandable by marketing executives. Practice a bit and the self-audit will take 6 minutes or less.
Ok then, let’s have a look at whether your expert’s work throws up any obvious danger signals. Please take note: There are many ways to evaluate the success of failure of a PPC account. Items 1 and 2 in this audit are terrific as worst-alert screening tests. Item 3 is more advanced. The testing requires you log into your AdWords account and following the instructions below.
1-Review Account Change History (Test Difficulty: Very Simple)
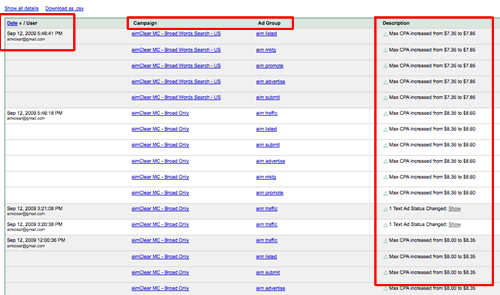
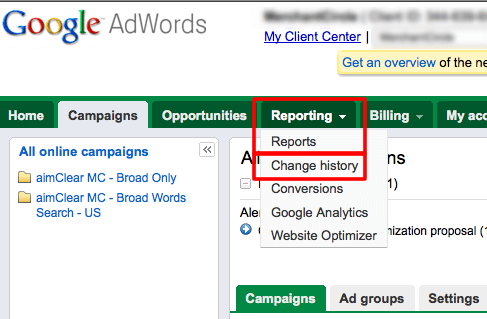
It’s extremely easy to audit the activity of your PPC manager for a time period. In the AdWords REPORTING tab, select CHANGE HISTORY.
Select the date range. Usually going back a month tells the story. Check the ALL box. We want to see everything our PPC management team has been up to. We’ll also see management moves called through the AdWords API. Click FILTER CHANGE HISTORY.
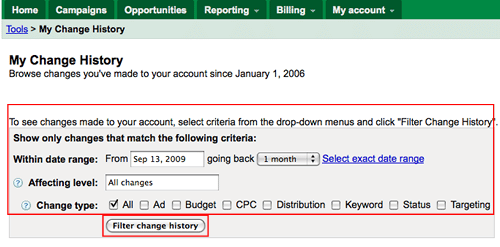
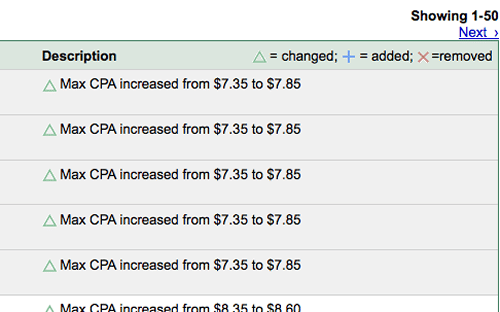
Take note of your pay per click manager’s activity…or not. Few substantial PPC accounts should go completely untouched for a month or even days. It’s super easy to see what AdGroups your PPC expert regularly modifies and tasks commonly undertaken. Targeting, status, keyword, distribution CPC, budget and ad management are displayed.
2-Check Keyword Quality Scores (Test Difficulty: Simple)
Google’s AdWords QualityScore (qScore) is made of several components, including the keyword’s relationship to the ad, landing page and clickthrough ratio (CTR). Measured on a scale of 1 (low) – 10 (high), a poor score can affect your keyword’s actual cost per click (CPC), how high the ad ranks or even whether the keyword is allowed in the PPC auction at all. For the purpose of this quick audit, we’re going to skim all account keywords.
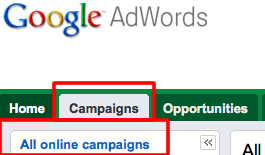
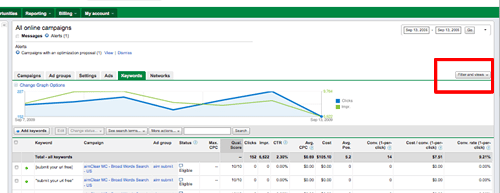
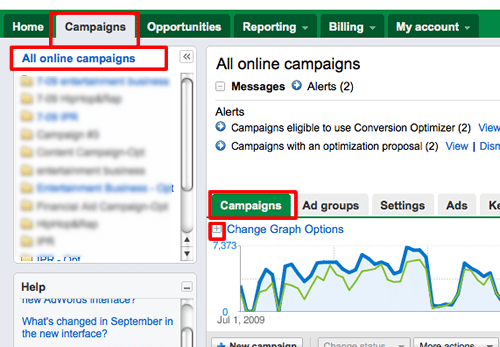
In the CAMPAIGNS tab click on ALL ONLINE CAMPAIGNS.
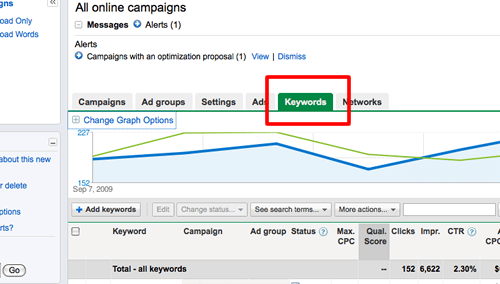
Then click KEYWORDS
Make sure the qScore is displayed in this view by clicking on the FILTERS AND VIEWS button.
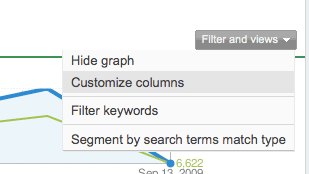
…and then CUSTOMIZE COLUMNS
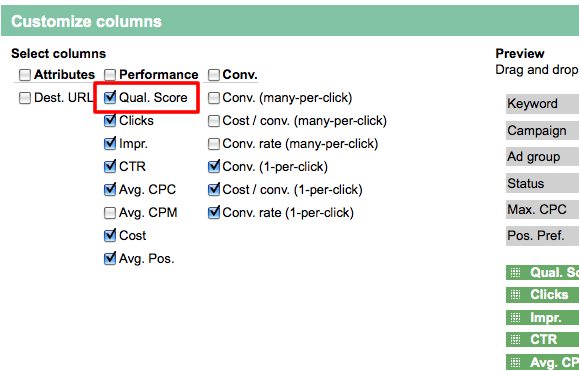
Check the QUAL. SCORE box.
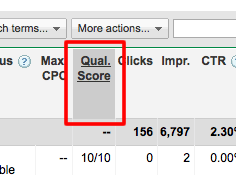
Toggle sorting qScores high to low or low to high by clicking on the column head.
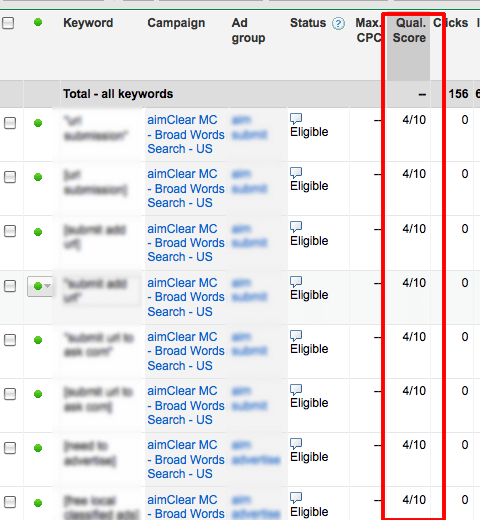
Then observe the general state of the keyword’s qScore. Remember that we’re looking at the whole campaign.
Low qScores (1-4) are not good, however it’s even worse if the bad qSCORE is for valuable keywords that get the most impressions. Having a bad qScore speaks to a systemic problem which could stem from a variety of issues in combination. PPC pros don’t accept low qScores and know how to fix them.
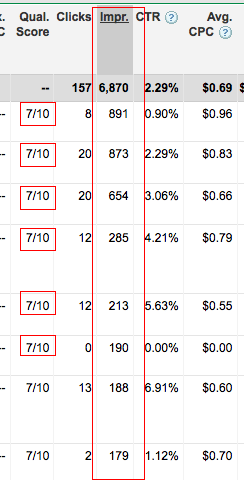
For a better idea how poor qScores could be affecting the whole campaign, sort the keywords by impressions (IMPR.). This sorts keywords by search frequency and therefore how many times a keywords triggered ads for the time period.
In this case the keywords with the most impressions have qScores of 7, which is pretty good. When keywords with lots of impressions have very low qScores, it’s a sign that things are out of control with the entire campaign.
3-Use Built in Trending Graph Options (Test Difficulty Scale: Moderate/Requires Discretion)
AdWords provides useful trending graph options which provides a cool 30,000 foot look at how things have progressed over time. Select CAMPAIGN/ALL ONLINE CAMPAIGNS/CAMPAIGN TAB/CHANGE GRAPH OPTIONS.
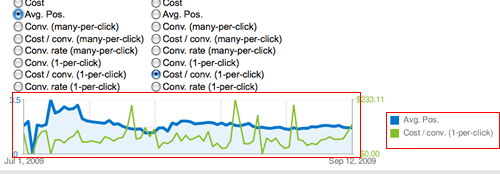
Select the TWO METRICS to select trends you wish to compare. In this case we’ve chosen to compare impressions and clicks over time. Experiment with the options for serious insight regarding performance. This graph shows conversions plotted next to cost. (Change the date range in the upper right)
At a high level, find out how things are going. Here we plot the affect ad position in Google has on conversion cost.
To conclude, by checking out the change history, it’s easy to find out in about 2 minutes whether your PPC expert is full of hooey or working your account. Spend another 2 minutes and gauge the qScore. Problems with quality score are an indicator of deeper problems. For armchair-trending (be careful, that’s what it is) spend a couple more free-forming the built in trending options. They can provide a lot of insight. We’re sure you PPC managers will appreciate how engaged a client you’ve become.
