Today we continue our forest-inspired journey into great content marketing. In Part I of this two-part post, we likened great content to the parts of a tree, from roots to the leaves. Today, we move from art to science by calling in a virtual “tree doctor” to better understand great content.
The Biodiversity Scientist: Measurement and Analyzing the Content Marketing Tree
A successful content strategy relies on every page and piece of content having a clear purpose and defined goals. Think, for a moment, about every page on your website, every landing page, billboard, every podcast audio commercial. If every asset were a salesperson, how many of them would be fired and how many would be promoted?
Apply that thinking to all elements of your content strategy. What do you keep? What do you promote?
After all the hard work creating content and getting people to see it, it’s time for a research scientist to enter the picture. Think of the arborist or tree doctor examining a tree to measure its growth so it can one day tower over us insignificant humans. Your content marketing is no different. We need the scientists behind the scenes tagging and analyzing the data to gain insights that inform an evolving amplification and messaging strategy.
Centering common language around business objectives, goals and KPIs is essential to getting internal stakeholders on the same page. Let’s be clear on a measurement framework. Adopting Avinash’s simple web measurement 101 framework is a great place to start.
Important Definitions:
- Business objectives: Why does your website exist?
- Goals: Specific strategies used to achieve your objective.
- Metrics: Simple – a number.
- KPI: the metric that illustrates how you’re doing against objectives.
- Target: Numeric values used to define success.
Here’s the zillion dollar question: Does your content actually drive conversions?
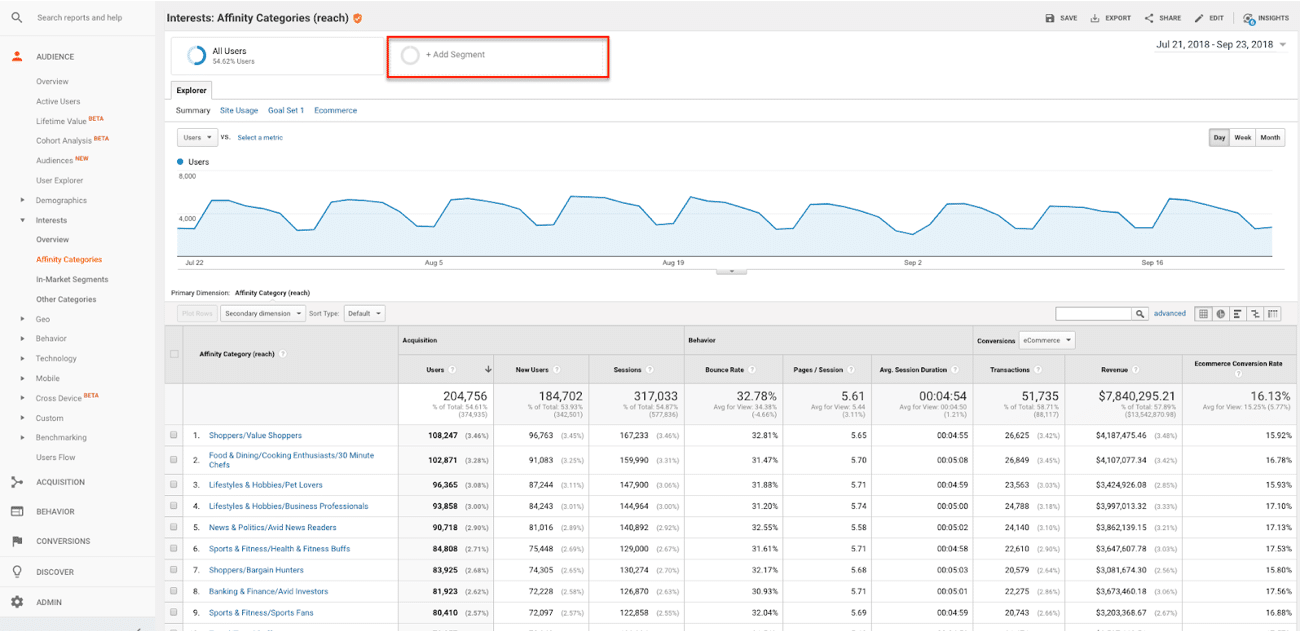
A reliable answer requires measuring goals and behavior on different pages through an analytics platform. For our purposes, let’s use Google Analytics to discover whether content is doing its job guiding users through your funnel.
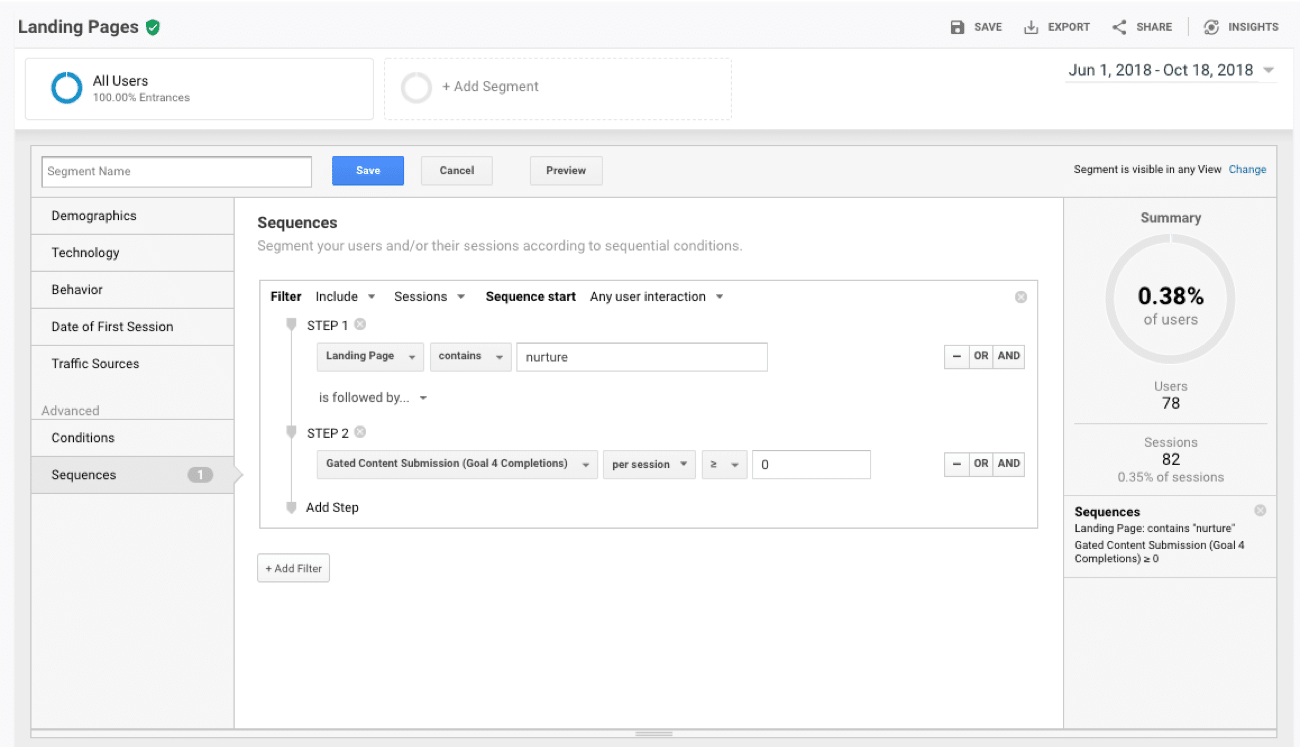
In this example, we examine whether an ebook is generating downloads. Login to Google Analytics and used the advanced segment functionality to create a view specific to the content and goals being measured. Click “Landing Pages” under the Site Content dropdown in the Behavior section (image below).
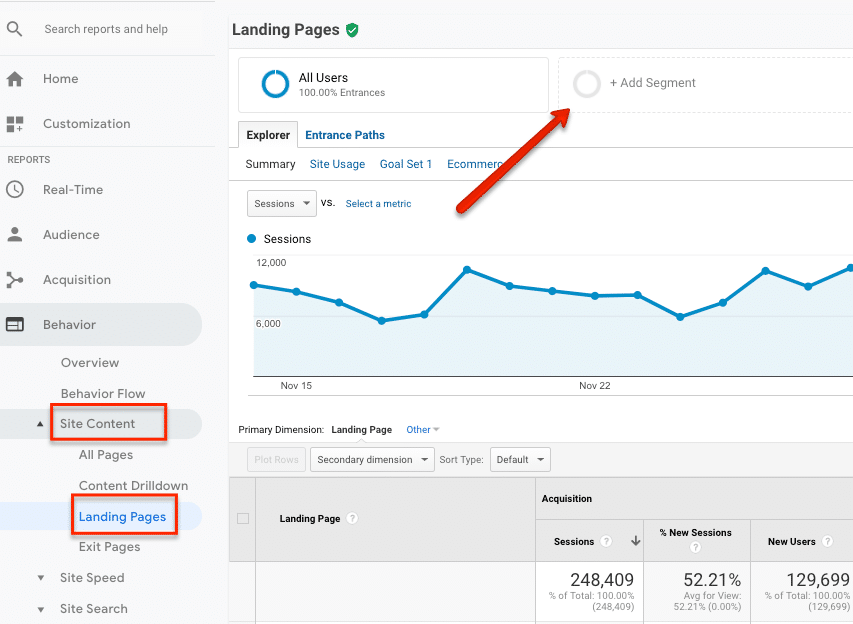
Once here, click on the Add Segment in the top middle / top right of the page.
Once you click into Advanced Segment, define a sequence. The example below is outlined:
- Landing page contains “nurture”
- Goal 4 completions > or = 0
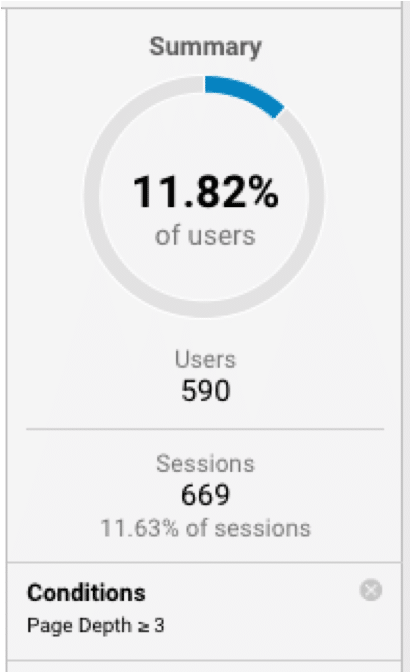
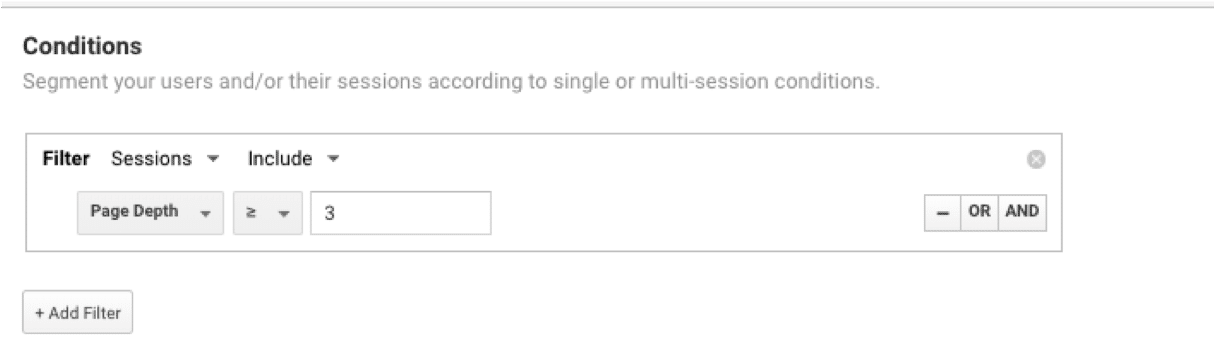
Next, let’s look at page depth engagement. Identifying content that engages users more deeply than average is a great way to tell when users are primed for conversion. Building audiences that engage with three or more pages within the site is great for retargeting audiences.
Scroll Depth Engagement
Using the power of Google Tag Manager and Google Analytics, it’s now super easy for marketers and brands to analyze deeper engagement metrics – like scroll depth tracking. With this feature, analytics can help answer the questions below:
- Do users consume more than 50% of of the content on any given page?
- Combining with time on page and scroll depth, do users watch the 2 minute video that is 50% of the way down the page? What is the conversion rate of users that watch the video vs those that do not watch the video?
- If the call to action is at the bottom of the page, what percentage of users make it to this content? Based upon average scroll depth, where is the ideal location for the CTA button?
Events need to be configured via Google Tag Manager, and then reports can be run in Google Analytics to demonstrate engagement levels.
Final note: Don’t expect every piece of content to be the panacea that yields stellar results. Content is part art, part science. The science we just covered in the previous section can go a long way to informing how we can continually develop content that will rock your business. The more the scientist and artist collaborate, the better.
Remember that content creators take great pride in their craft. Most don’t want to create content for the sake of creating content. They want to create content that actually makes a difference, which brings us back to the tree analogy one final time. The leaves (content) have a lifecycle. Eventually, each leaf runs its course and falls to the ground. The content – and all of the findings from the data scientist – replenish the roots (the strategy) and strengthen the tree overall.
With each iteration of your content tree, the roots, trunk, branches and leaves become healthier over time.