The Duluth News Tribune has published an article I wrote, “Local View: Deeper dig into data reveals concern for Duluth tourism.” To form the article, I worked with teammates who measure interest in brands of all kinds, from local businesses to some of the largest companies in the world. This blog post provides data behind the newspaper article and also includes additional concerns not included in the DNT.
Duluth is a world-class, stunning, travel destination. Tourism is a primary industry offering visitors attractive options in various categories and subcategories including travel, tourism, food and drink, arts and entertainment, water sports, leisure activities, pursuit of hobbies, and more.
The pandemic was tough on travel/tourism businesses in many places, including Duluth. And, for some cities, 2022 was something of a rebound year.
Recently, Minnesotans have seen the results of PR efforts surrounding Duluth’s self-graded tourism performance, tapping narrow first-party data. Quite possibly, these efforts were done to boost public perceptions and smooth the way for future tourism investments. AIMCLEAR decided to trust, but verify, claims that Duluth’s brand has recovered from the pandemic and is growing. Our study uncovered troubling questions dwelling not far below the surface PR.
This post presents data from AIMCLEAR‘s Duluth Brand Rebound Study, compiling third-party data. We pose the following questions:
- How has Duluth’s brand prominence fared in 2022 compared with pre-pandemic levels?
- Has Duluth’s brand recovered compared with previous levels?
- Is measuring 2022 tourism collections, adjusted for estimated inflation compared to 2019, 2020, and 2021 a reliable brand lift measure?
- Does higher brand impressions, how many total people in target audiences were exposed to messaging, mean Duluth’s marketing is successful?
- Did Duluth realize a brand lift as a byproduct of changes in marketing structure and the use of external agencies?
- How does a sampling of other cities in Minnesota and South Dakota interested in attracting visitors compare with Duluth’s performance?
- Additional Considerations: Business & Industry, Youtube, Google Paid Keywords, Duluth & Travel South Dakota, and self grading with first party data
When it comes to measuring bankable brand prominence, a branding “halo” if you will, marketers reach for various tools for metrics. AIMCLEAR and other marketers utilize third-party platforms to parse huge data. Sources can include Google, social media activity inside and outside of official channels, Facebook Ads inventory, trended programmatic partners data, earned media, and other channels.
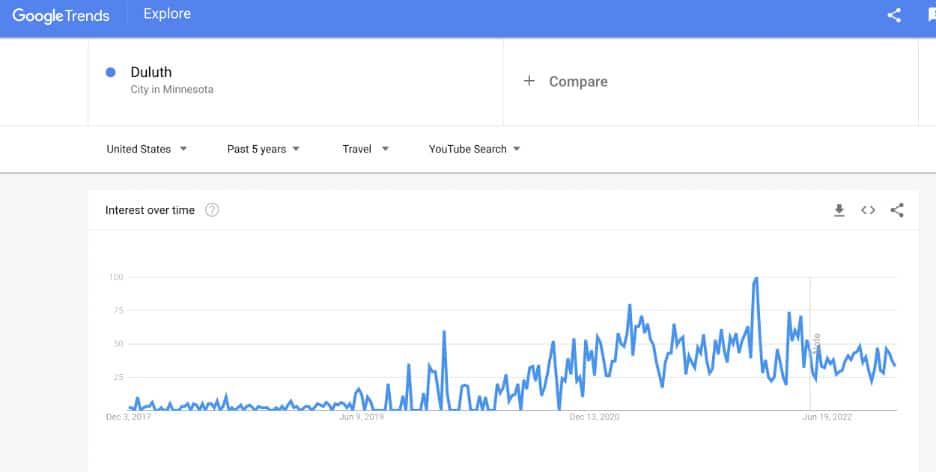
AIMCLEAR used Google Trends for this study. Google processes more than 100,000 search queries per second. Those ~8.5 billion+ daily searches are tendered by humans researching most anything and provide valuable insights into current and future behaviors. Google Trends search interest is one of the purest forms of gauging brand interest because Google is a common method for would-be customers to seek information about a specific brand, whether it be Tesla or Apple – or visiting a destination such as Duluth, Minnesota.
Other brand measurement channels can be illuminating, but the rubber meets the road further down the funnel when potential customers seek, search, preview, and purchase. In destination marketing we call that putting, “Heads in beds.”
Trends tells us who searches for thematically related keyword clusters over time. Trends is almost universally in the mix correlating tightly with other channels and first party data. Trends data is anonymized (no one is personally identified), categorized (determining the topic for a search query) and aggregated (grouped together).
For those who like to parse data, this is essentially the process we used:
- Measured search interest in the City of Duluth Trends object, quarterly, all categories.

- Established our control data using an average of 2018 and 2019 performance (pre-pandemic).
- Compared Duluth in 2022 vs. itself for the average of 2018 and 2019.
- Selected 2018 and 2019 because they were the most recent years fully predating COVID.
- This is key. Any comparison of 2022 comparing it to 2020 and 2021 data returns skewed results.
- Segmented Trends by travel/tourism categories and subcategories for 2022 vs. baseline control data.
- Applied the methodology to four other cities: Alexandria, MN, Brainerd, MN, Rapid City, SD, and Sioux Falls, SD. These cities are within a reasonable driving radius, have a range of travel attractions, serve up varied promotional tactics, and have relational data in-range worth comparing with Duluth’s.
- Even without the comparison cities, it’s enough to note Duluth’s 2022 performance vs. its own 2018/2019 search interest. The other cities are to provide additional perspective.
- Compiled data for the four other the cities vs. themselves, individually and averaged.
- Compared Duluth’s performance vs. the averaged comparison cities.
- Additional Considerations: Business & Industry, Youtube, Google Paid Keywords, Duluth & Travel South Dakota, Travel South Dakota Content Targeting Twin Cities Tourists, Notes Self-Grading with First Party Data

THE DULUTH TOURISM REBOUND STUDY
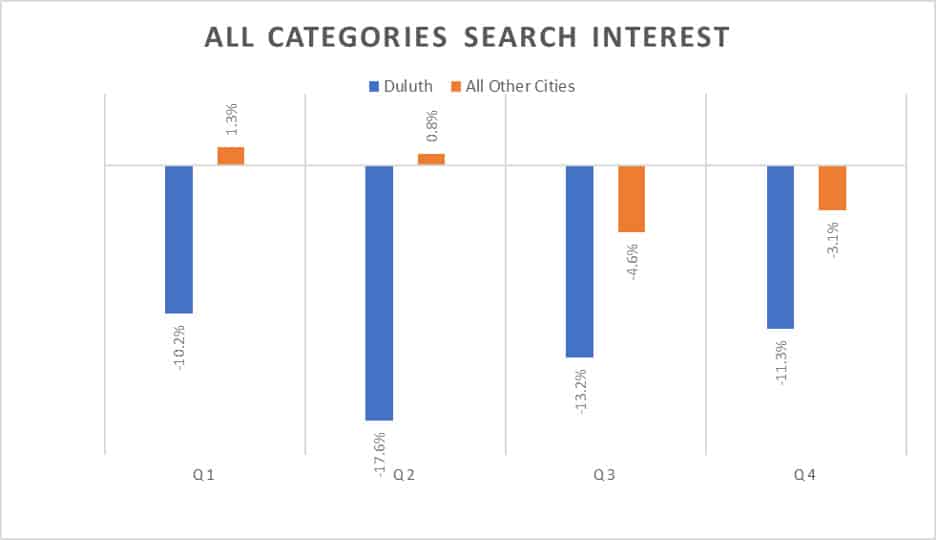
In the first chart the gray horizontal line (left to right) is the control data (average search interest of 2018 and 2019) for all Google Trends categories by quarter. The blue bars measure Duluth’s overall brand search interest, all quarters negative. The orange bars show all comparison cities averaged. The whole of Duluth’s 2022 performance was far below pre-pandemic control data levels. Duluth has a way to go toward an actual full recovery. Other cites had stronger recoveries even though that means less negative Q3 and Q4.
Next is the same data trended over 12-month cycles. Of particular note, the other cities show trend lines closer to their pre-pandemic control trend line while Duluth lags distinctly below pre-pandemic search interest. The blue line is the control, Duluth’s average of 2018/2019. The gray line is 2022 search interest lagging behind control in recovery. All other cities averaged are nearly on track with their control data.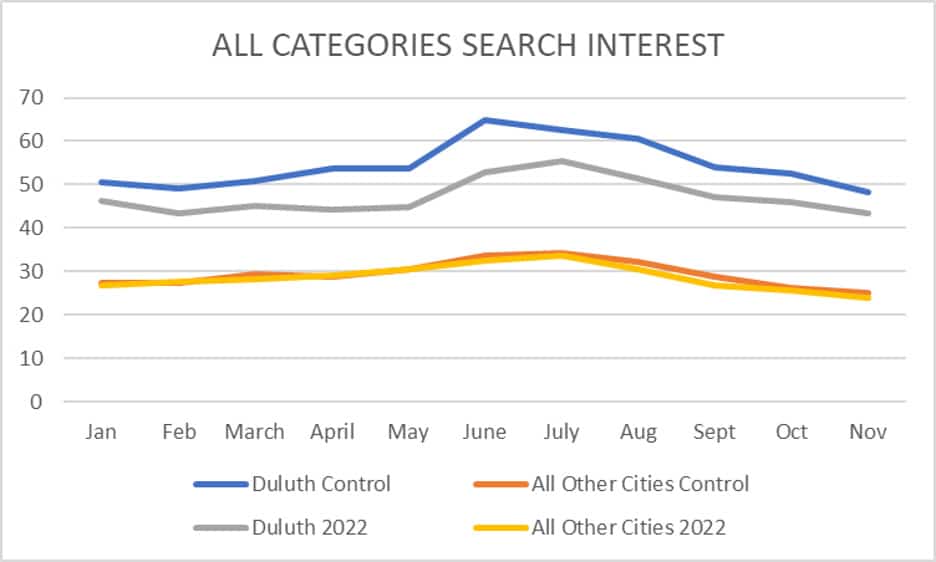
The next chart segments travel and tourism-related Google Trends categories and subcategories. There is some good news in that we see growth in the food and drink category. Yet, key travel and tourism segments remain depressed.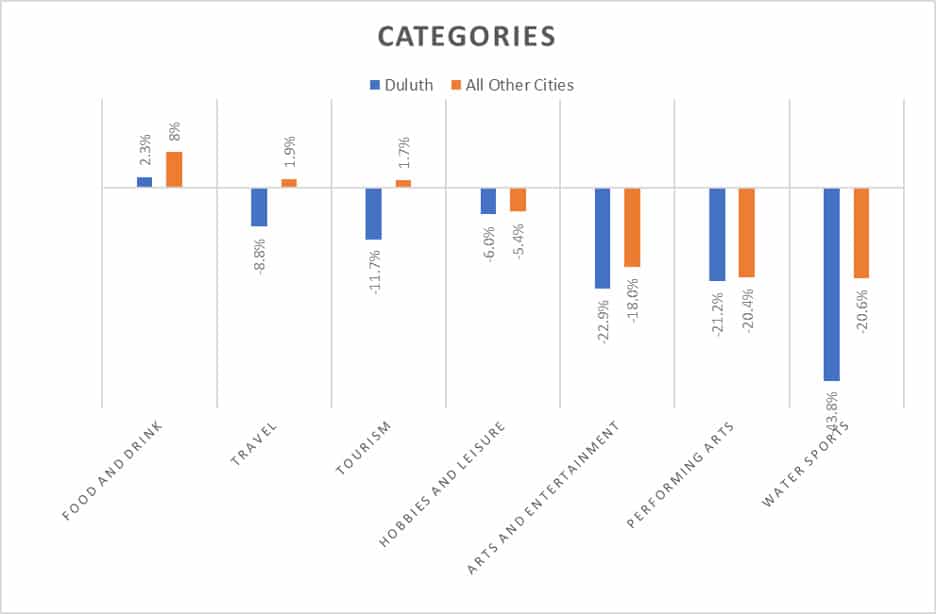
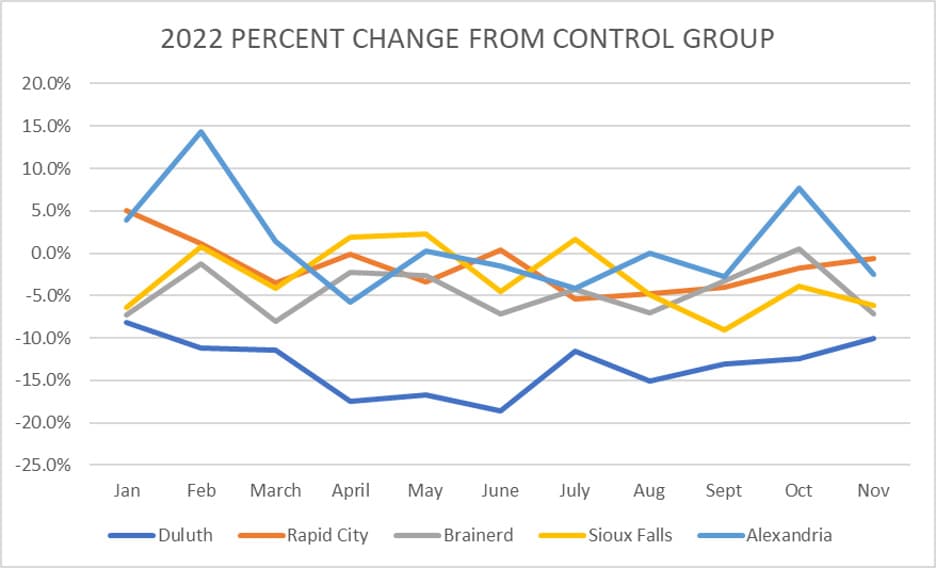
The next chart is another visualization of all Google Trends categories segmented by cities. The 0% line establishes 2018/2019 control data for each city. A value of 0% would indicate a return to 2018/2019 levels. Duluth entered 2022 below its control. The dark blue line shows Duluth never rebounded, even to where we were in January. Duluth lost ground in 2022 vs. control.
ADDITIONAL CONSIDERATIONS
- Business & Industry
- Youtube
- Google Paid Keywords, Duluth & Travel South Dakota
- Content on Travel South Dakota Targeting Twin Cities Tourists
- Self Grading with First Party Data
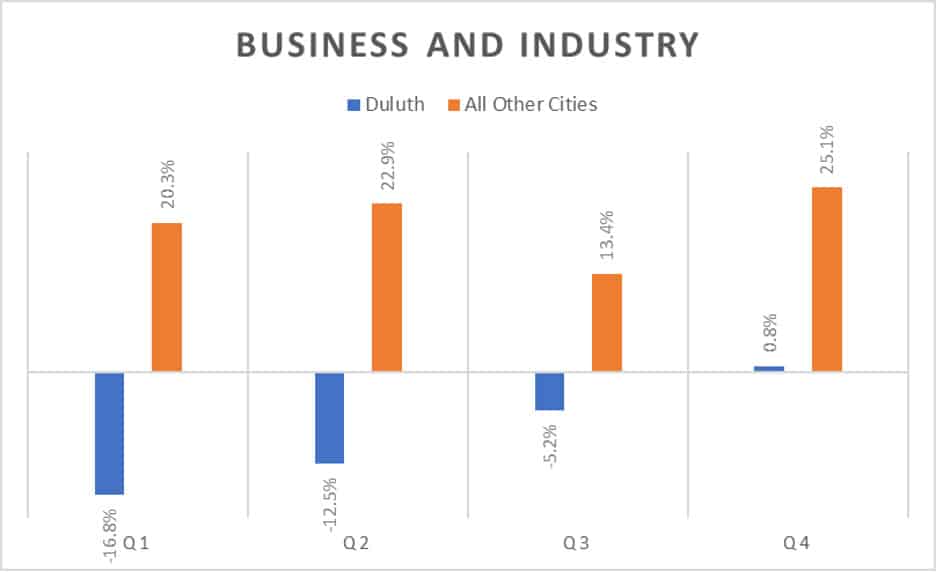
Business and Industry
Business and Industry is a dedicated Trends category. Business is tied to tourism. Convention visitors stay in hotel rooms, eat at restaurants, and other nodes. In Q4, 2022, Trends interest for the Duluth Business and Industry category fought it’s way back to pre-pandemic levels. Still, Duluth has not enjoyed the bigger bounce some other cities have actualized. Comparison cities averaged are crushing Duluth’s business and industry search interest recovery.
Youtube
We also studied Trends to investigate Duluth’s status in YouTube. This is an important parallel study, because YouTube is the second-largest search engine. Google Trends also provides search interest data marketers use to help understand branding halo in YouTube.
In late 2019 Duluth’s brand interest climbed steadily in the Youtube Trends Travel category and sustained through 2020 and 2021, making comparison to those years applicable. However, 2022 YouTube search interest in the Travel category was essentially lower or flat throughout the year.
In the Youtube Travel category, the following chart shows that 2022 trailed previous years for much of 2022. While Youtube search interest caught up to previous growth at various points in 2022, there was no substantial increase in YouTube search interest in 2022. Duluth did not realize a branding lift in YouTube
.
Consider how many have shifted travel-specific search activities. YouTube is stacked with travel content providing endless hours of immersive, topic-specific travel videos. Interested in top romantic weekend getaways? Craving to know where the best mountain biking trips are in the upper Midwest? Want to know where to get mountain-like skiing within four hours of Minneapolis? You’ll find content on YouTube.
Mindful of that reality, consider that for all of Duluth’s focus on glossy video ads and fair winds blowing from previous years the Visit Duluth Youtube channel today has 480 subscribers and flat travel related search interest. 2022 was a missed opportunity.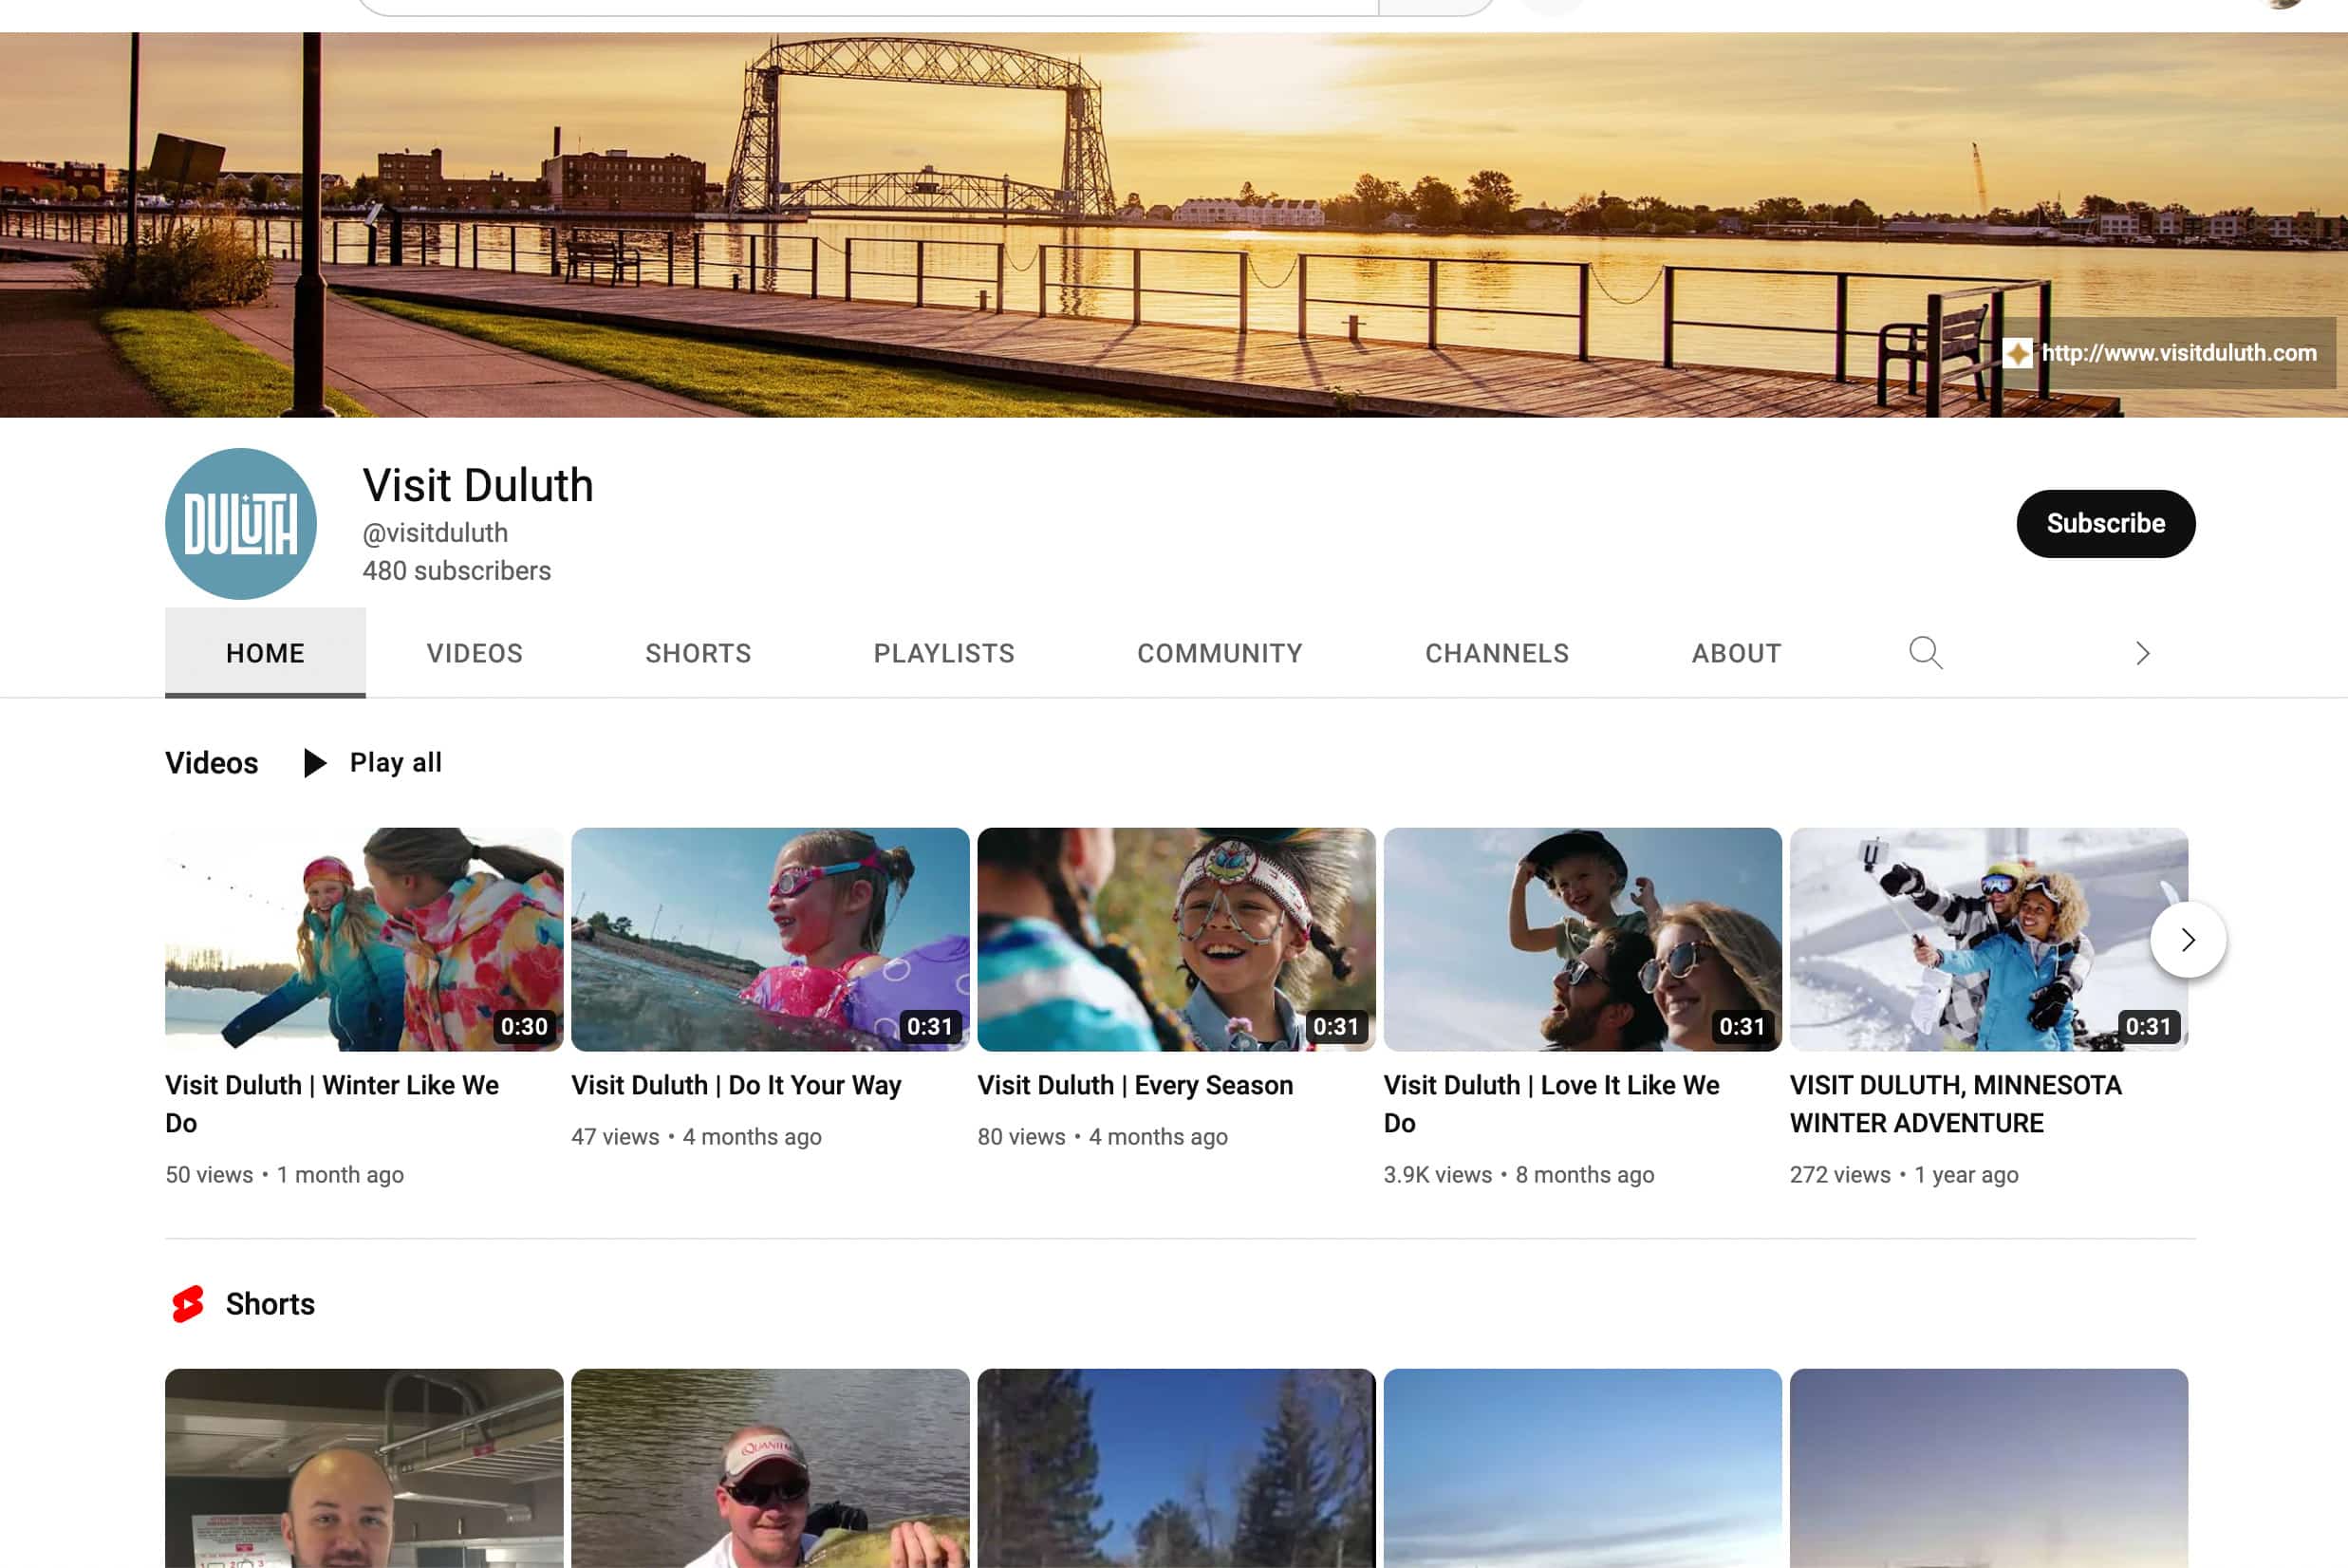
Google Paid Search Ads
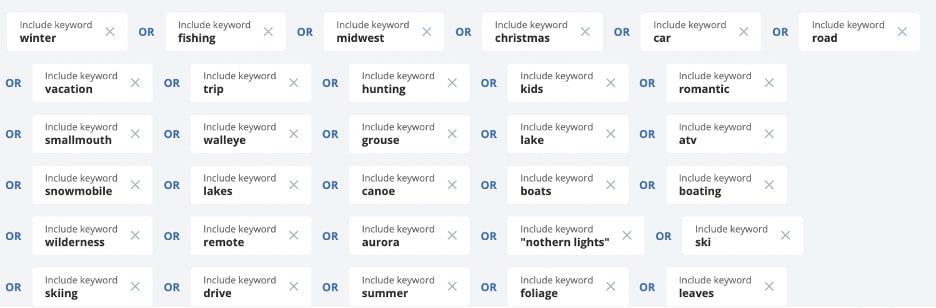
VisitDuluth(.)com also bought paid search keywords on Google during 2022. Online search keywords purchased by the Duluth team were seemingly devoid of phrases that included these and other obvious travel- and tourism-promoting words: fishing, lakes, Lake Superior, boating, wilderness, skiing, summer, leaves, foliage, Christmas, and vacation with kids. According to standard third party data (Semrush and SpyFu), Duluth’s paid search ads were not triggered by keywords including any of these words.
Some keywords Duluth’s tourism team did purchase were actually the same keywords that local tourism businesses, “hotels” in particular, sought. That paid keyword competition could have not only resulted in redundancy but also may have ratcheted up the cost of those keywords for the very businesses that the city was trying to help.
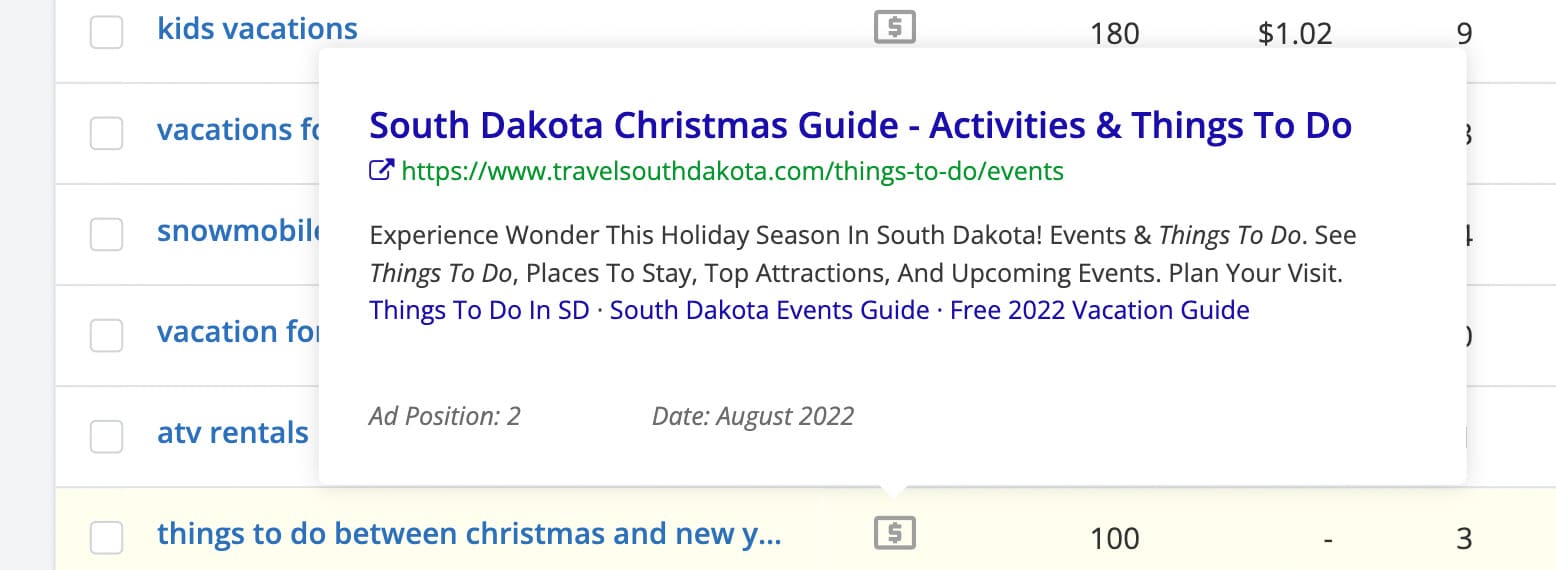
Meanwhile, Travel South Dakota purchased phrases that included, “Things to do between Christmas and New Year’s Day.”
Travel South Dakota ran this ad in April, 2022 targeting the phrase,”Vacation with kids.”
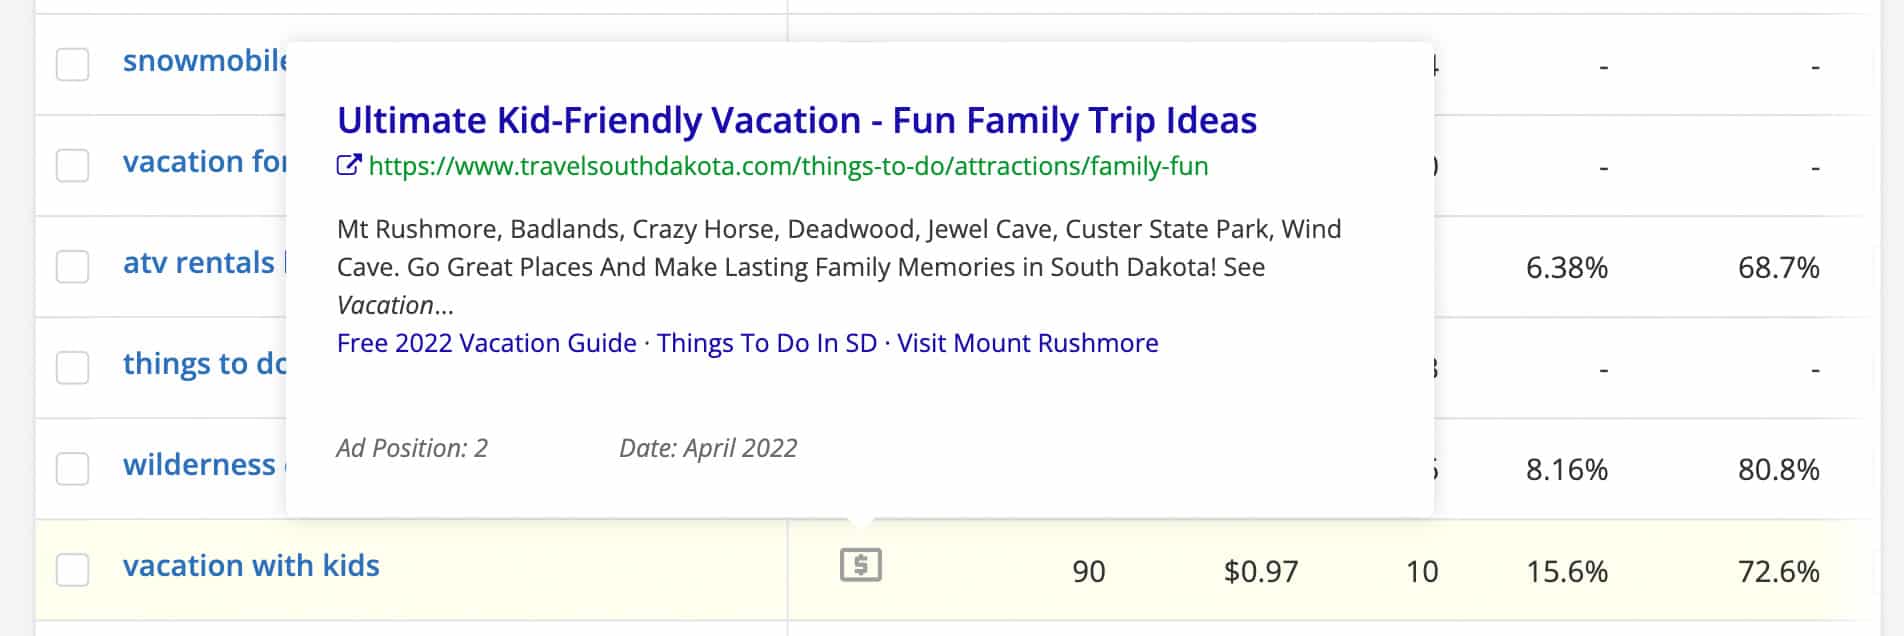 Given that Duluth and South Dakota share the same marketing agencies, it is natural to wonder why our competitors to the southwest of Duluth reaped the benefit of paid keyword marketing surrounding kids, vacation, Christmas etc. while Duluth did not. Duluth seems to have ceded this ground to South Dakota. Keep in mind South Dakota itself is within roadtrip radius of Duluth.
Adding confusion, Travel South Dakota has content on it’s website directly poaching Twin Cities road-trippers to visit Hill City, SDand other SD destinations. Ouch.
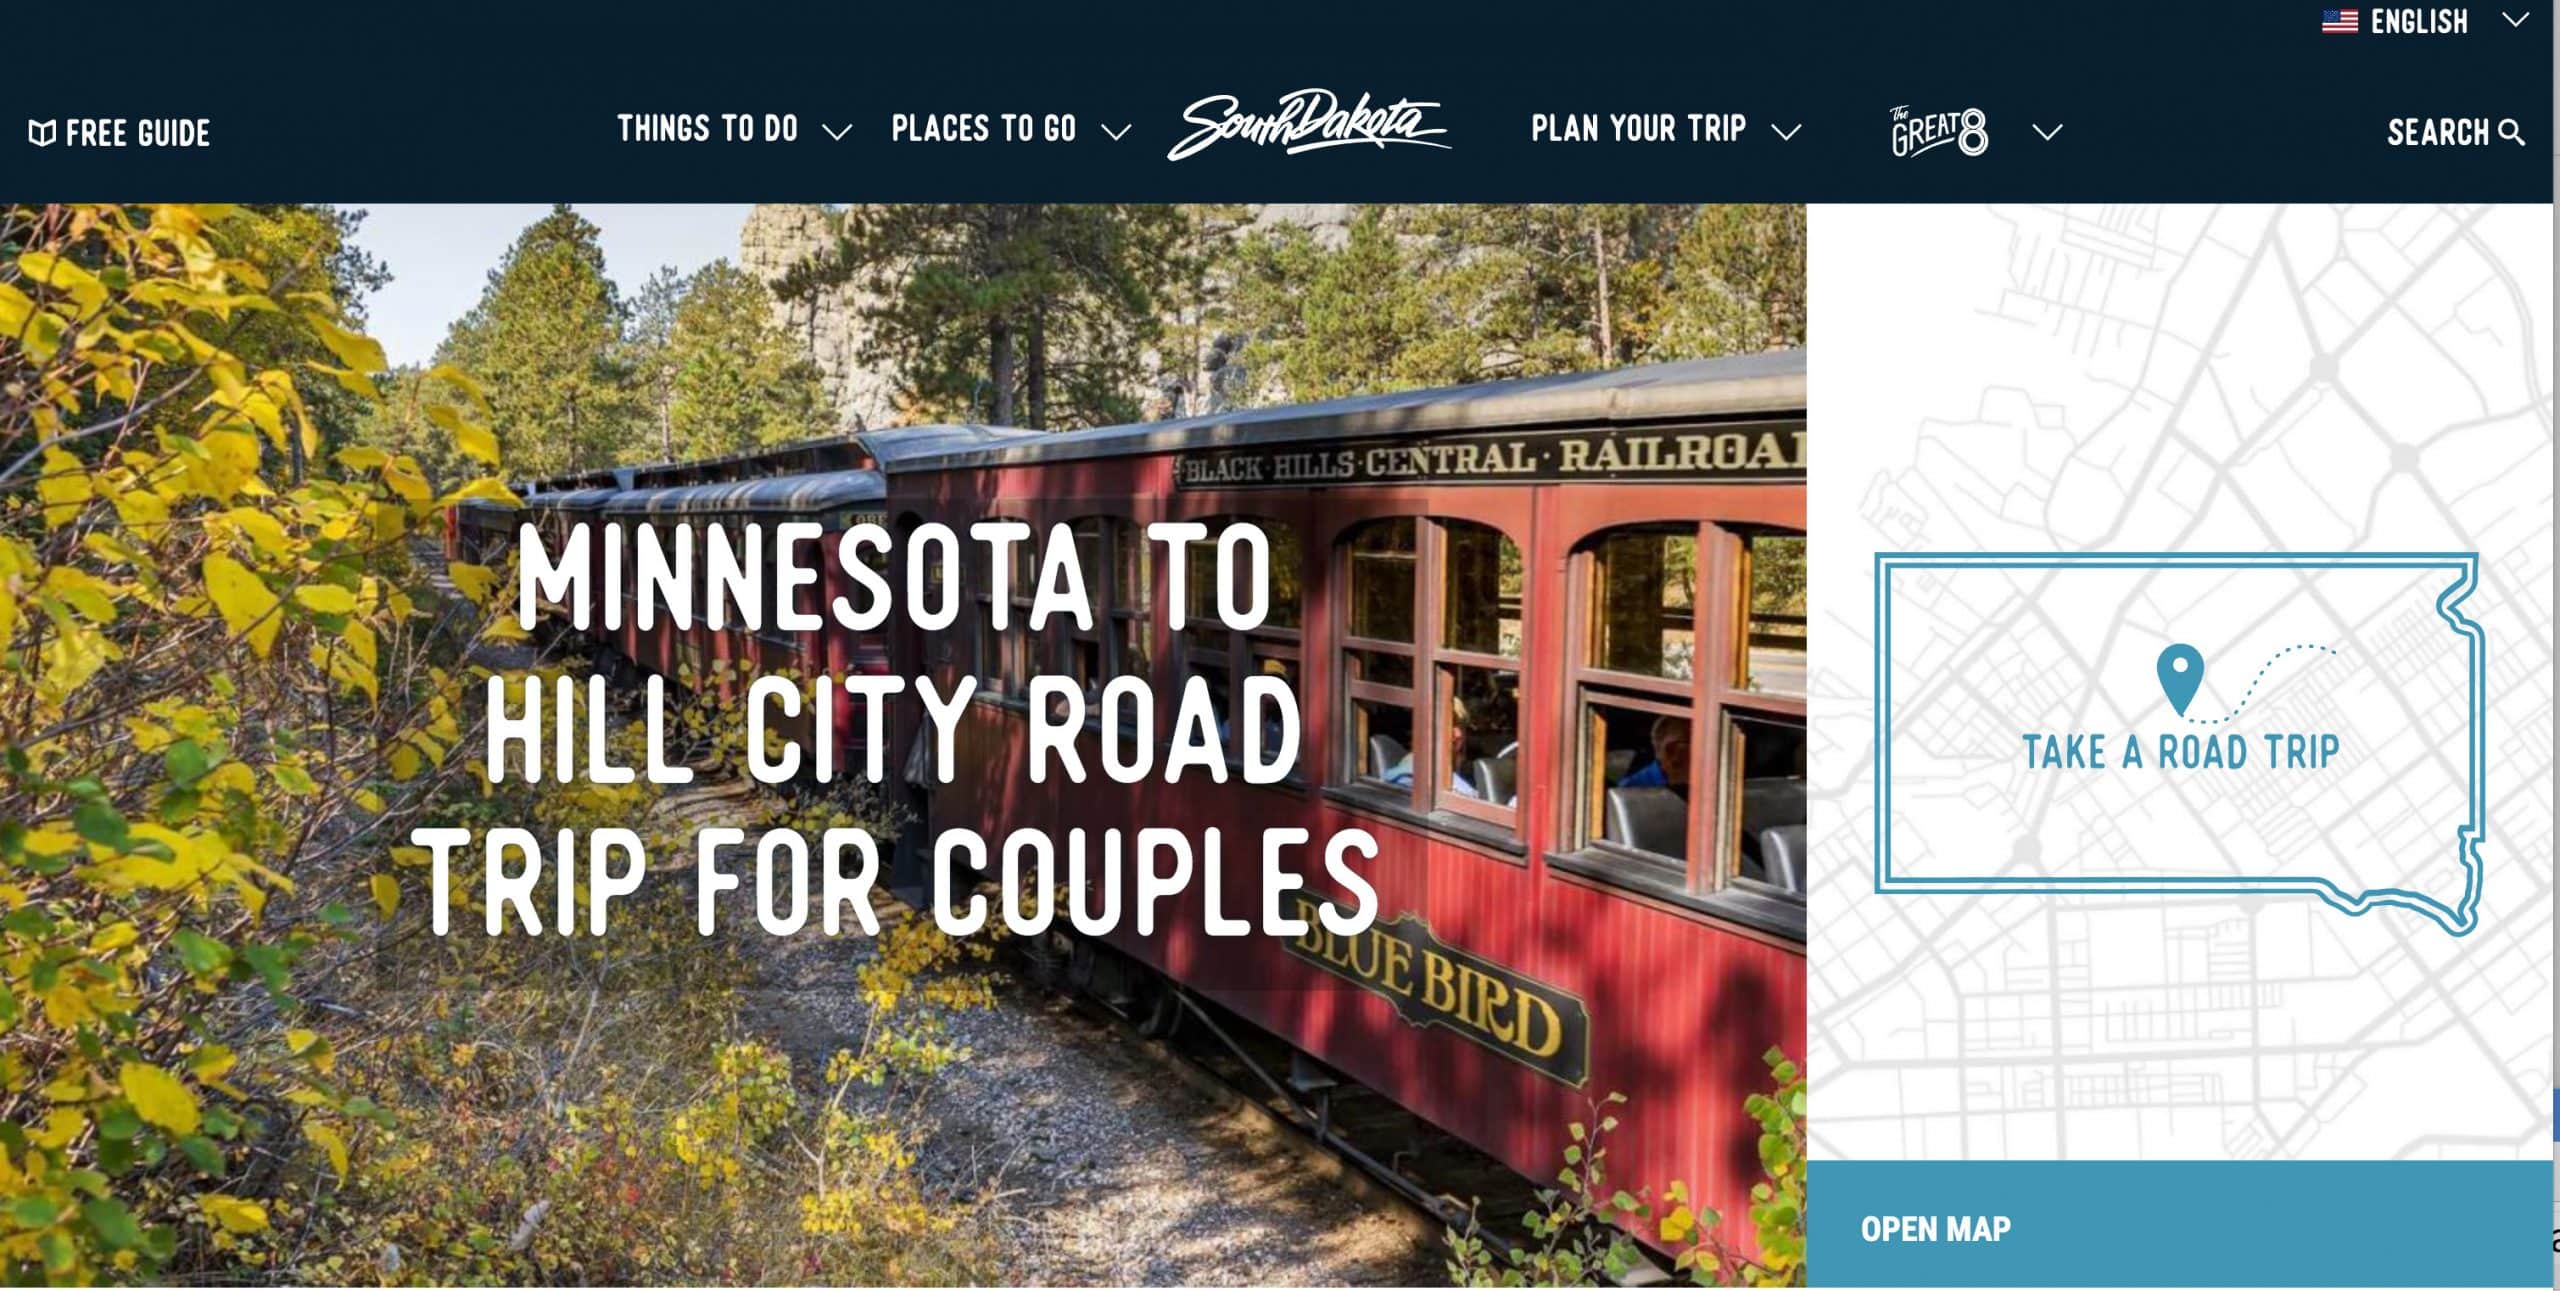
The Travel South Dakota post reads: “But if planning an actual getaway from Minneapolis seems tedious, don’t worry, we’ve mapped out the best pitstop, park and patisserie for you to visit on your passionate passage to Hill City, South Dakota.”
Here’s another: Minneapolis to Yankton Road Trip: Get Outdoors: “DAY 1 Minneapolis’ Blue Earth (2ish hours)”
SEO
In 2022, VisitDuluth(.)com did a good job cleaning up a messy search engine optimization legacy, shedding a high volume of useless keywords while acquiring better keywords. Still, VisitDuluth(.)com is still not a fully accessible website, which is concerning, given the public nature of the website and modern focus on user accessibility.
Self Grading with First Party Data
Let’s look back at the recent self-graded assessment of marketing performance, which was lauded in regional media. The 2022 lift claims in Duluth’s tourism collections as a top line metric is the same fodder Duluth mayors have often used to politicize key performance success indicators (KPIs) dating back to the time Duluth put in the bricks on Superior Street and transformed Canal Park from scrapyard to scenic wonderland.
“We are up 13% in our collections, and that even accounts for inflation, which we would count for about 8%, we are up 5% over significant other years, 20, 21, 2019. We are outperforming other markets.” Emily Larson, 11/30/2022
“Awareness of Duluth is growing as well. To date, we have seen more than 525 million impressions with earned media coverage in Minnesota, regional, and national outlets,”
“We’ve seen growth in tourism tax revenue (up 11.3% year to date)” Tricia Hobbs, Senior Economic Developer Senior Economic Developer City of Duluth, 12/26/2022
Let’s dissect these points. Leading with “13%” or “11.3% year to date” to the media before carefully considering inflation and other variables, highlights an inflated percentage, part-one of a formula, before important subtraction within a transparent algorithm – perhaps to help shape headlines. The real number in the statement suggests a lift in collections of either ~+5% ~3%. The inflation-adjusted number is suspect, at best, as it compares to data which includes bottomed-out years of the pandemic.
For instance, tourism tax collections as a single metric does not adjust expectations for previous years’ shortages of hotel rooms vs. availability today and added taxation opportunities from vacation rentals. To further explain an increase in tourism collections, check the inflation rate of local hotel rooms vs. overall inflation. In 2022 it has been difficult to hire hotel staff, especially cleaners. So, some hotels have had to raise room prices to limit occupancy without hurting revenue. An important Duluth attraction responded to report they were slightly down from 2021 and had hoped for more from the new team.
Measuring gross impressions (a standalone PR measure of how many total people in target audiences were exposed to messaging) can include ads and content which did not move the needle as evidenced further down-funnel. Now that we have the Internet, impressions is a more valuable data point as part of an algorithm including search interest and true first party data in an algorithm designed for something other than media opps. In today’s social media and advertising environment, 525 million impressions is not difficult to attain by integrated paid and organic methods and a questionable standalone growth indicator in light of lagging search interest.
Including 2020 in any relativity calculations for tourism performance leads to questions. Depending on the market, hotels experienced cratering revenues for 2020. For example, In Duluth, ZMC Hotels closed the Edgewater Hotel & Waterpark from Mid-March to Mid-June, 2020. Many of the top players in the hotel industry don’t even use 2020 as a benchmark since it is so skewed.
“All these numbers the city is quoting are just spaghetti the city hopes will stick to the wall.”
John Goldfine, Former, Long time President, ZMC Hotels, Foundational Tourism Executive

Here’s how another tourism-centric agency owner described tax collections as a primary KPI to grade marketing agency performance:
“Using tourism tax collections is too superficial a number to judge an agency’s performance. Collections are an aggregate of many business’ efforts from biggest to smallest tourism enterprises – a reflection of everybody’s situation and approach.
Tourism collection adjusted for inflation up 5% over other years, including 2020 – the most disastrous year for hotels in anyone’s memory, barely if at all eclipses year-over-year collection lifts historically generated by VisitDuluth.”
Considering the major paradigm shift moving away from VisitDuluth as the official marketing agency to two agencies and a city staffer being in charge, did Duluth outperform a ten-year average at the same time as removing jobs and impacting the local marketing industry? And still, as in previous years, city government to justify strategy is reaching for superfluous top line data points with no attribution or other KPIs.
When Duluth’s new marketing agencies were hired and no Duluth agencies were invited to the table, ostensibly data transparency and new, more vital KPIs were a big part of the sell. What were these KPIs and where are they? How did Duluth break into new markets? What’s different?”

Why is AIMCLEAR so interested in this topic? We work closely with businesses in the region that rely, at some level, on tourism dollars. Many of us are proud residents of Duluth and we want this area to thrive. Finally, virtually every human in the area is touched by tourism at some level. Everyone in the community has a right to know the actual state of affairs with the tourism industry.
Let’s face it, without travelers spending millions of dollars in the region, Duluth would be a very different place than it is today. Tourism transformed Duluth from a struggling “last one out turn off the lights” community to a thriving travel destination and gateway to the North and South Shores of Lake Superior. It has become a true jewel that should be a top choice for countless people wanting an epic family winter getaway, a romantic adventure, an affordable family trip, a thrilling mountain bike weekend with friends, and so much more.
For Duluth to truly come back after the near-apocalyptic pandemic era, it needs to drive interest, capture intent-based search, and remind people precisely why this is one of the top destinations anywhere.
A healthy tourism industry is an essential component in Duluth being the multifaceted, dynamic hub for a wide range of industry that it can be. With a quality of life that is exceptional, a range of activities for all tastes, four extraordinary seasons, unmatched beauty, and really good people, Duluth can (and will) draw tourists, businesses, and more.