
Adjusting bids in Google Ads based on the weather has long been a fantasized topic among marketers. In theory, the concept sounds impactful. In practice, easy to implement. In reality, it can be simple to scale in the proper framework.
This post will walk you through setting up the initial framework to analyze and optimize your Google Ads campaigns based on weather patterns (at scale). Note that this is intended to be friendly to both marketers and developers, with Python & SQL examples.
To create this framework, we’ll focus on the following areas:
- Data warehouse
- Weather API
- Required datasets
- Putting it together
Data Warehouse
The first thing you need to build this framework is a place to hold and integrate your data – this comes in the form of the data warehouse. Google BigQuery can be a good option for marketing-related activities, because it affords easy integrations with Google-related platforms. Stand up a Google Cloud Platform project and activate your data warehouse.
Weather API
Next, we need solid weather data. While many weather APIs exist, we’ve seen good results using the Dark Sky API. Set up is fast, simple, and you’ll be developing in a matter of minutes in an HTTP request format. The simplest Python request example is below:
import requests
response = requests.get(“https://api.darksky.net/forecast/<YOUR-API-KEY>/<LATITUDE>,<LONGITUDE>,<UNIX_DAY>)
encode = response.json()
As you can see, the request is based on longitude, latitude, and day inputs. For example, we can pull the weather for Charleston, South Carolina on 2019-01-01. Likewise, we could pull the weather for Charleston for today.
When you make the request above, a json-formatted chunk of information will be returned. This will ultimately need to be parsed, but we’ll go through an example of the data structure at a high-level:
{
“latitude”: 42.3601,
“longitude”: -71.0589,
“timezone”: “America/New_York”,
“currently”: {
“time”: 1509993277,
“summary”: “Drizzle”,
“icon”: “rain”,
“nearestStormDistance”: 0,
“precipIntensity”: 0.0089,
“precipIntensityError”: 0.0046,
“precipProbability”: 0.9,
“precipType”: “rain”,
“temperature”: 66.1,
“apparentTemperature”: 66.31,
“dewPoint”: 60.77,
“humidity”: 0.83,
“pressure”: 1010.34,
“windSpeed”: 5.59,
“windGust”: 12.03,
“windBearing”: 246,
“cloudCover”: 0.7,
“uvIndex”: 1,
“visibility”: 9.84,
“ozone”: 267.44
},
Right away, there are some great options that could correlate with campaign performance. Here are a few of our favorites:
- icon: a consistent, summarized status of the weather. Is your performance better or worse when ‘rain’ is the weather?
- precipIntensity: The higher this number, the more intense the weather is.
Finish parsing this data with a simple ‘for’ loop and pass it into the data warehouse to begin working with the other data.
Geographic Datasets
If you’re familiar with the Google Ads platform, you likely see the gap in our current process: we need a longitude and latitude. Our next steps will easily combine the following:
- Google Ads Location Criteria
- Google Ads Geographic Performance
- City Longitude + Latitude
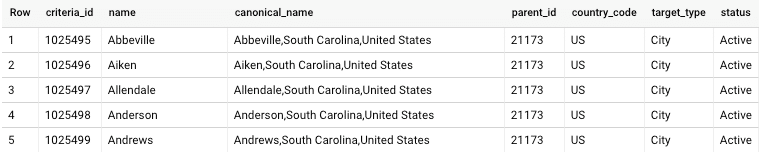
Google Ads campaigns target locations, and each of these cities in the Google Ads platform correspond to a location ID specific to Google Ads. We can import a master document of locations and their IDs into our data warehouse.
Below you’ll see an example of the dataset; notice how we have our criteria_id for Google Ads but not our longitude or latitude.
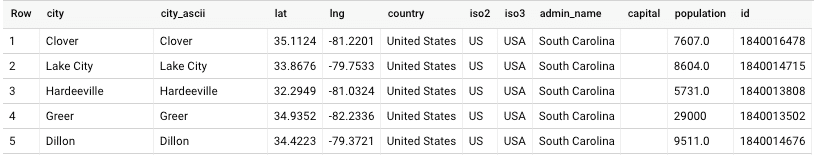
Bringing Google Ads locations together with longitude and latitude can be done via an import from simplemaps World Cities Database. This will give us most cities with their longitude and latitude to integrate with our Google Ads data.
Finally, you’ll need to bring in your Google Ads performance data by geo. Pull a geo performance report from the API to accomplish this.
Putting It Together
So far, we’ve amassed the following tables in our data warehouse:
- Dark Sky weather API
- Google Ads geographic performance
- Google Ads location criteria
- World Cities locations
First, let’s join our Google Ads criteria ID to the world cities data. A simple left join with a concatenation will accomplish this. As you can see in the datasets above, Google Ads has the canonical name, where worldcities does not. We can join city, admin, and country in worldcities to create a key that matches Google Ads:
#standardSQL
SELECT
city,
city_ascii,
lat,
lng,
country,
iso2,
iso3,
admin_name,
capital,
population,
id,
criteria_id AS google_id
FROM
`<PROJECT>.<DATASET>.t_geographic_worldcities` AS world
LEFT JOIN
`<PROJECT>.<DATASET>.t_geographic_googleads_location_criteria` AS google
ON
CONCAT(world.city,”,”,world.admin_name,”,”,world.country) = google.canonical_name
WHERE
country_code = ‘US’;
Save this new table as ‘t_geographic_googleads_worldcities’ or something similar. To create a scalable infrastructure, we need any city that a marketer wants to use in Google Ads to show up in this system.
We can now take the table above and only select the currently targeted cities. The query below uses a RANK statement to only take the currently targeted IDs from the ‘t_googleads_geos’ table. Remember, this is our Google Ads geographic performance data streaming in from our campaigns.
#standardSQL
SELECT DISTINCT
a.ExternalCustomerId,
a.CampaignId,
a.CampaignStatus,
a.CityCriteriaId,
a.IsTargetingLocation,
b.lat AS lat,
b.lng AS lng,
b.googleads_city
FROM (
SELECT
date,
ExternalCustomerId,
CampaignId,
CampaignStatus,
CityCriteriaId,
IsTargetingLocation,
RANK() OVER(PARTITION BY ExternalCustomerId ORDER BY date DESC) rank
FROM
`<PROJECT>.<DATASET>.t_googleads_geos`
WHERE
CampaignStatus = ‘enabled’
AND IsTargetingLocation = ‘True’) AS a
LEFT JOIN
`<PROJECT>.<DATASET>.t_geographic_googleads_worldcities` AS b
ON
a.CityCriteriaId = b.adwords_criteria_id
WHERE
rank=1;
I strongly recommend using this most recent table to feed your Python script in a dynamic way. Doing so will ensure weather data is always populating with the relevant longitude and latitude options. The new table will look like this:
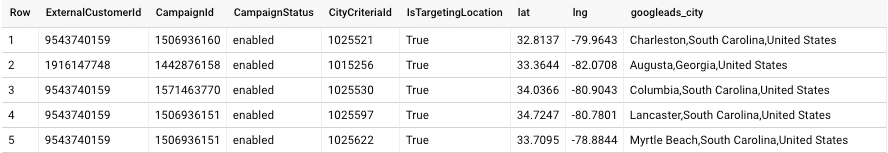
Now we have our account ID campaign ID, and campaign status, all with our longitude and latitude! Feed this information into your system.
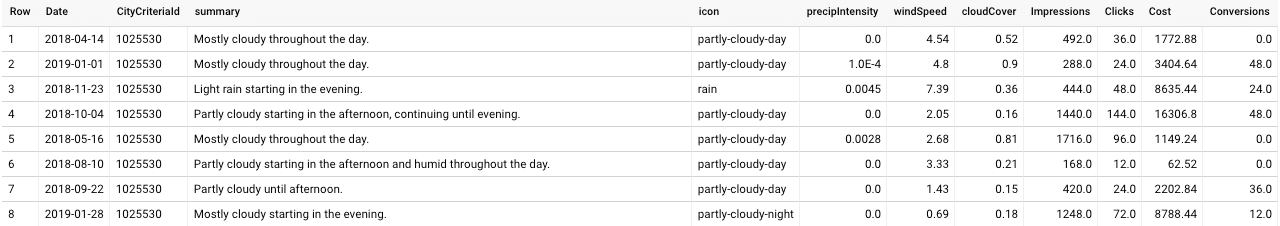
The final step is to do a simple integration between performance data and Google Ads criteria ID. Note that it’s possible to get more granular, such as down to the campaign-level, but for this example we’ll keep it at a higher level.
The following query takes performance data from our Google Ads geos and joins it with the weather for each day.
#standardSQL
SELECT
adwords.Date,
adwords.CityCriteriaId,
weather.summary,
weather.icon,
weather.precipIntensity,
weather.windSpeed,
weather.cloudCover,
SUM(CAST(adwords.Impressions AS float64)) AS Impressions,
SUM(CAST(adwords.Clicks AS float64)) AS Clicks,
ROUND(SUM(CAST(adwords.Cost AS float64))/1000000,2) AS Cost,
SUM(CAST(adwords.Conversions AS float64)) AS Conversions
FROM
`<PROJECT>.<DATASET>.t_googleads_geos` AS adwords
LEFT JOIN (
SELECT
date,
adwords_city_id,
summary,
icon,
precipIntensity,
windSpeed,
cloudCover
FROM
`<PROJECT>.<DATASET>.t_geographic_weather_test` ) AS weather
ON
adwords.Date = weather.Date
AND adwords.CityCriteriaId = weather.adwords_city_id
GROUP BY
1, 2, 3, 4, 5, 6, 7;
The final data output will allow an analysis to ultimately see if there are channel performance differences based on the weather. In this example, there certainly were surprising performance differences when viewed at scale.
If a correlation between the weather patterns and your campaign performance is found, then work to automate all of the inputs above and scale your system. Of course, there is more that would go into building the system to modify your bids or budgets – but we’ll save that for a different day.