It is said that today’s branding is tomorrow’s conversion. Still, generations of digital marketers chased metrics to justify branding investments. This blog post offers a how-to guide for next gen paid advertisers, SEO practitioners, brand managers, and marketing leadership to change the equation. You’ll be equipped to hack Google for “100% Theoretical Impression Share,” a new datapoint for high performance brands.
Reasonable measurement of branding success has always been touchy. Branding ROI tracking has been further damaged by GDPR, CCPA, challenges attributing multiple cross-channel touches, hyper-sanctity of PII (personally identifiable information), Google’s staggering lack of transparency (especially for high ticket paying advertisers), Apple’s weaponization of privacy, and ultimately loss of tracking cookies.
With the techniques we’ll share here, companies can now invest in branding with much more confidence to quantify revenue. We’ll use Google tools to prove lift for brand keywords in psychographic segments and associated ROI no matter which channel is used for branding, from Facebook to OTT, Sirius XM to YouTube and TikTok. Brand search and associated revenue is often a solid indicator of successful branding campaigns – unless there is a reputation crisis causing a rise in search trends.
In 2023 we tasked the AIMCLEAR data as services team to realize our 15-year vision: to visualize trended search frequency calculated in specific psychographic audiences, code name, “Pony on Acid.” Super trends plotting requirements include keyword search frequency trended:
- In Boolean Psychographic Audiences
- To Specific Geographics (Zips, DMA, Radius)
- For KWs Including Brand, and/or (Sub)Category, Concepts
- Attribute CAC, ROAS to Search Frequency Lifts and/or Declines
- Needs to Cost Relatively Little
- Essentially Buy (Much) More Valuable Google Trends
(Power users can skip now past explanation of Google Trends, down to: ###########)
Google Trends, General Data for General Use Cases
Let’s step back. Google Trends, like Webmaster Tools, Google Ads, GA4, Keyword Planner, etc. grudgingly give just enough data to keep marketers smart enough to sell Google and dumb enough so as not to game – or at least minimize system hacks to win higher prominence and lower costs. Here’s an overview:
Google Trends documentation states: “Numbers represent search interest relative to the highest point on the chart for the given region and time. A value of 100 is the peak popularity for the term. A value of 50 means that the term is half as popular. A score of 0 means there was not enough data for this term.
As an example, this Trends graph plots search interest for Canon, Sony Alpha, Fujifilm, and OM Systems cameras models.
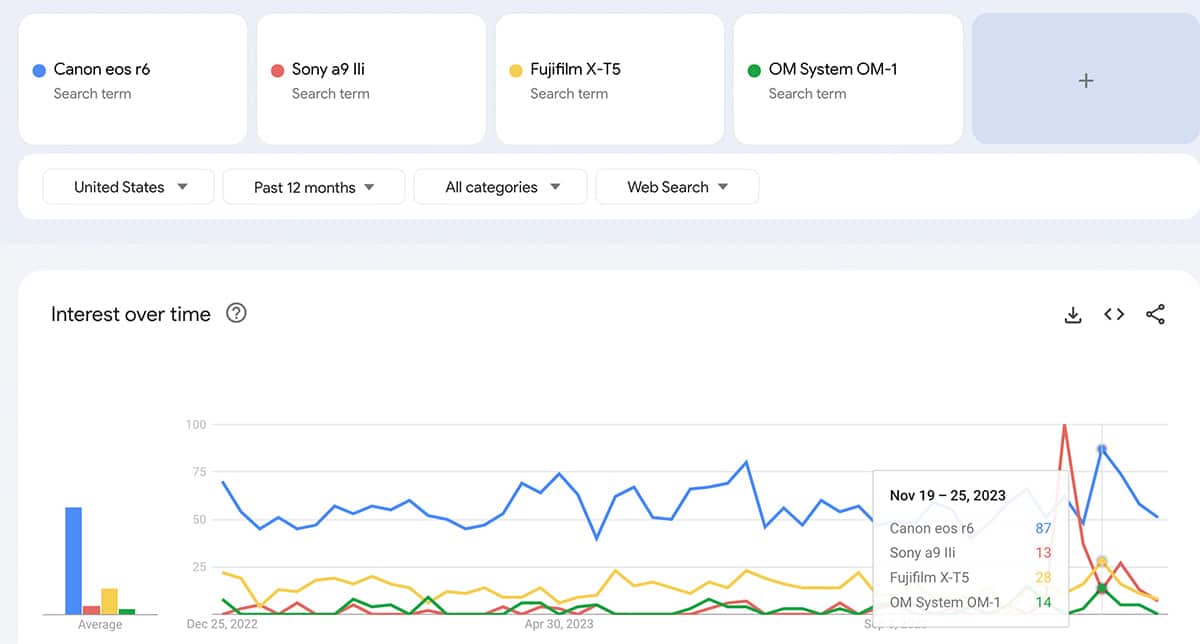
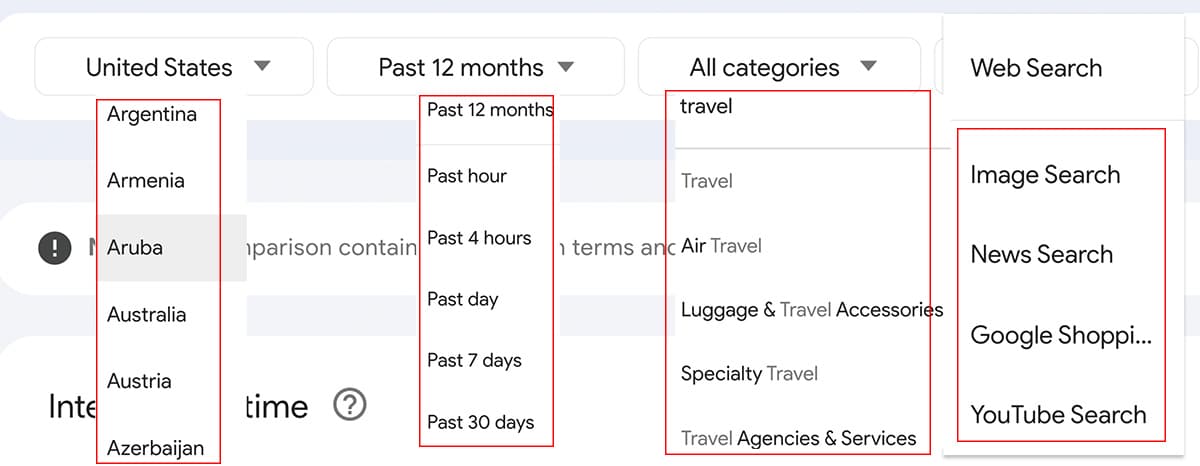
We may select a geographic region, date range, category, subcategory, and Google channel to study.
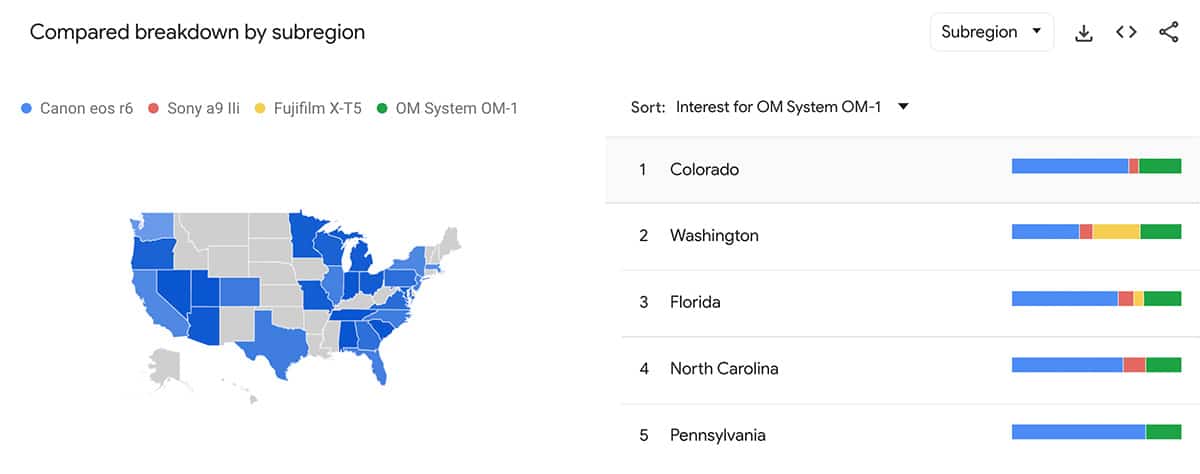
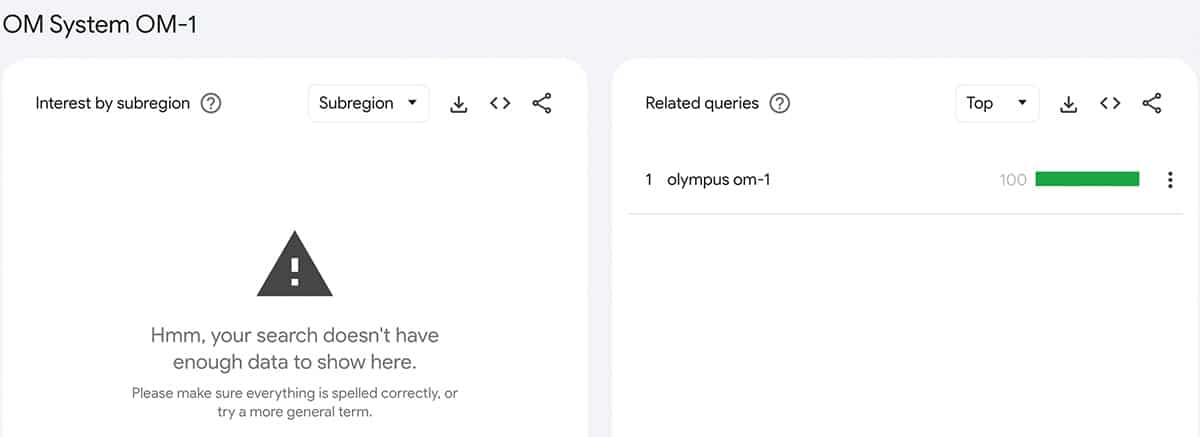
Trends also provides a very general breakout of geographic interest, top and rising searches for each keyword in the report.
Google Trends runs out of data quickly for keywords with less search interest. Search interest for OM-System OM-1 is statistically insignificant compared to other the other cameras in the report.
##########
Welcome back Power Users.
Google Trends Cool? Sure, for zoomed out studies, but not near heavy enough to guide serious marketing investments. Yep, Google Trends can be a valuable tool for some use cases, for instance studying subcategorized tourism interests, newsjacking, trended comparisons, etc. GT provides so few, puny datapoints.
My Little Google Trends Pony

Google Trends is simply the wrong tool to measure sophisticated branding investments, just smart enough to dumb down marketing.

Now, back to our “Pony on Acid” super trends requirements. The ask was to plot keyword search frequency trended:
- In Boolean Psychographic Audiences
- To Specific Geographics (Zips, DMA, Radius)
- For KWs Including Brand, and/or (Sub)Category, Concepts
- Attribute CAC, ROAS to Search Frequency Lifts and/or Declines.
- Needs to Cost Relatively Little
- Essentially Buy (Much) More Valuable Google Trends
Introducing 100% Theoretical Impression Share (T.I.S.)
![]() The concept of “trended 100% theoretical impression share” (TIS) means what would happen if Google Ads targeting an AdGroup achieved maximum possible visibility, appearing every possible time active Google users fit criteria for targeting (in this case selected keywords in an demographic or psychographic audience).
The concept of “trended 100% theoretical impression share” (TIS) means what would happen if Google Ads targeting an AdGroup achieved maximum possible visibility, appearing every possible time active Google users fit criteria for targeting (in this case selected keywords in an demographic or psychographic audience).
We call 100% TIS “theoretical,” because total visibility is limited by several factors including quality score, bid, budget, etc. While impossible or nearly impossible to attain, 100% TIS can be back calculated from actual Google spends mashing up keywords in psychographic audiences, measuring KPIs including search volume, ROAS (Return on Ad Spend), CAC (Customer Acquisition Cost), and therefore growth of brand and/or concepts.
In other words, we’ve proved use of small, relatively inexpensive, keyword buys in Google Ads to create our super trends report – and you can too. To pull the audacious assignment off, we asked, “What if it is possible to buy 100% search impression share for (a) keyword(s) in Google Ads (b) segmented by complex psychographic audiences and (c) Geos the (c) calculate total available search frequency- trended?” A targeting example is a Google user searching from a Chicago zip code for “authentic Oktoberfest costumes” also in market for both a trip to Munich AND shirts and tops.
To track the evolution of search volume in this compound audience, we can make small, explicit buys of Google paid search targeted to psychographic audience segments and geos, then calculate 100% T.I.S. from actual impressions purchased and impressions share percentage. Google provides both metrics for advertisers to hack. The formula is:
The mojo is in setting up AdGroup targeting. First create a Combined segment in Google audience manager.
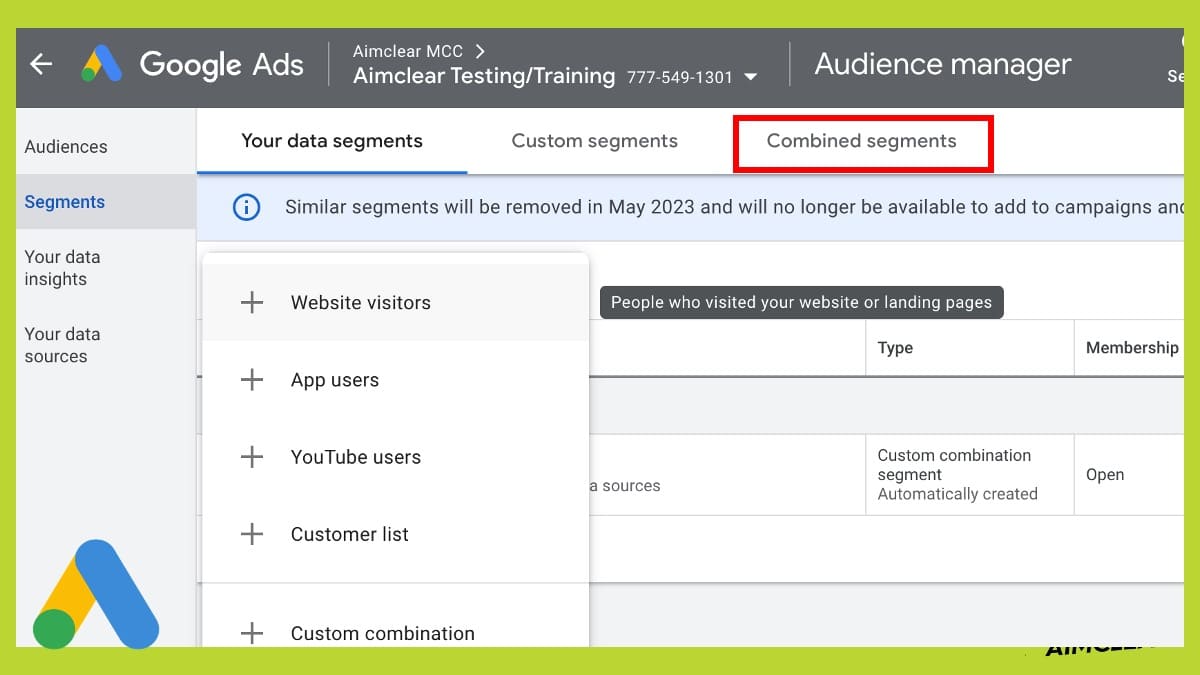
Remember that Google allows for Boolean targeting using the AND operator, etc.
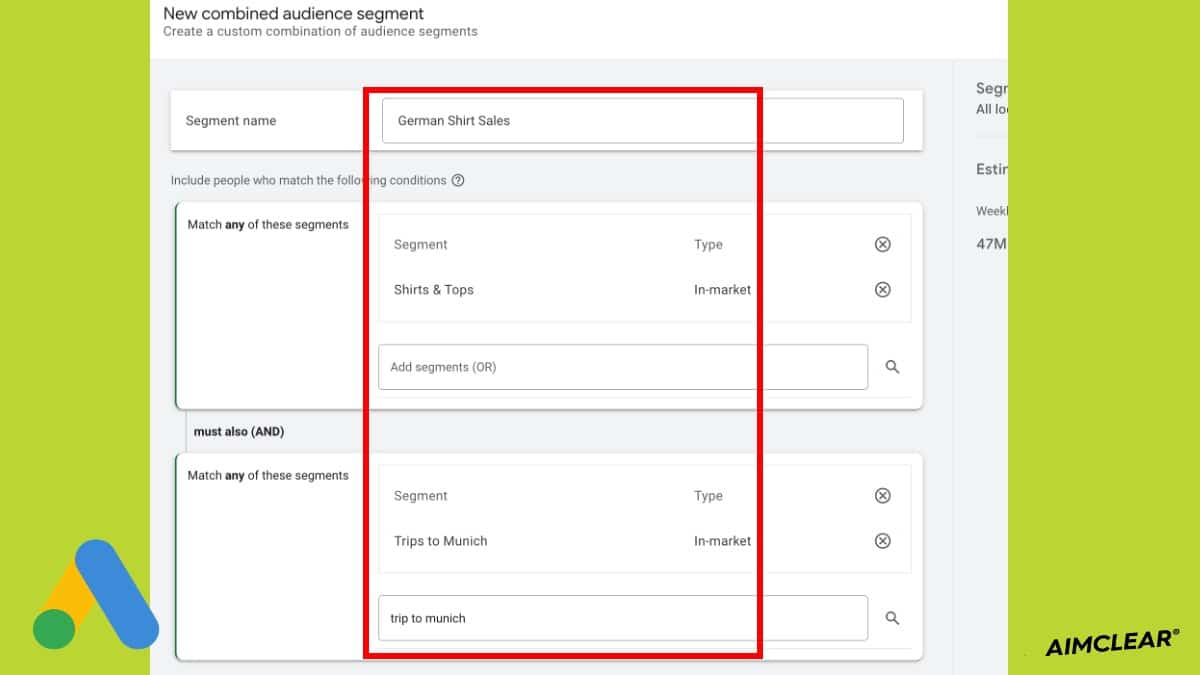
When setting up the AdGroup for trended measurement, target keywords to the Combined audience segment.
AIMCLEAR 100% Theoretical Impression Share Trends Visualization Example
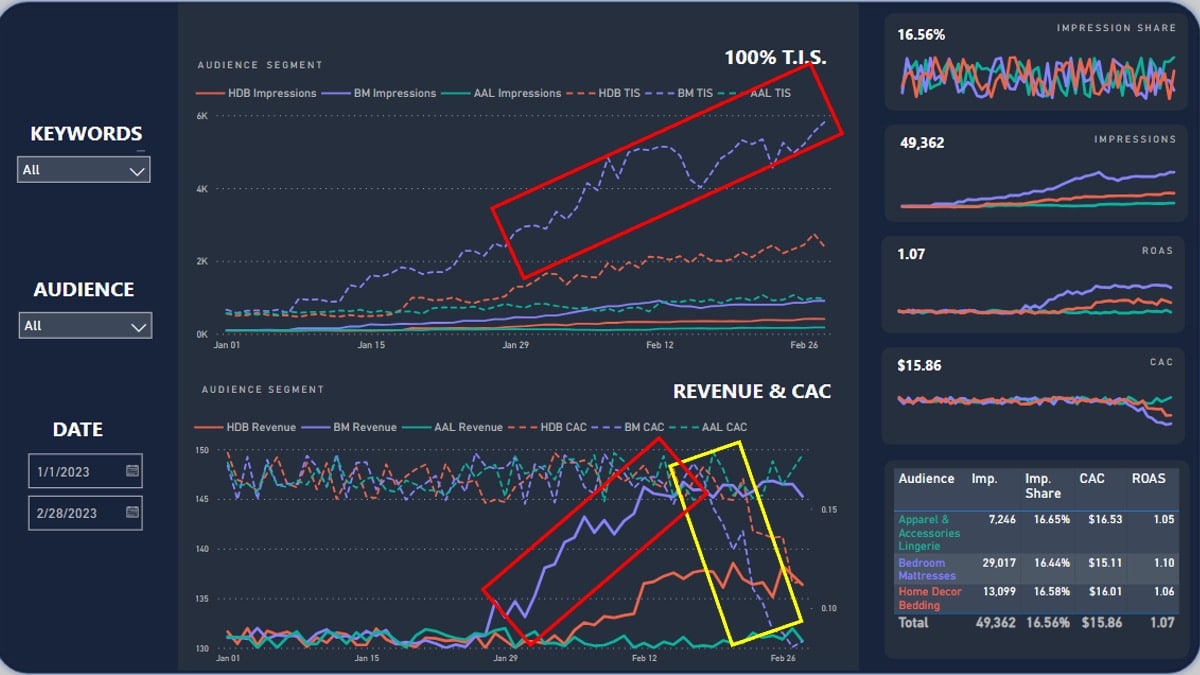
The following screen captures use example data, so as not to reveal any client metrics. In the upper left, select targeting. In this use case example, the keywords are brand keywords.
Moving down the left column, we’ve selected all audiences we’re studying – also noted in the lower right. Assume the keywords are all branded keywords.
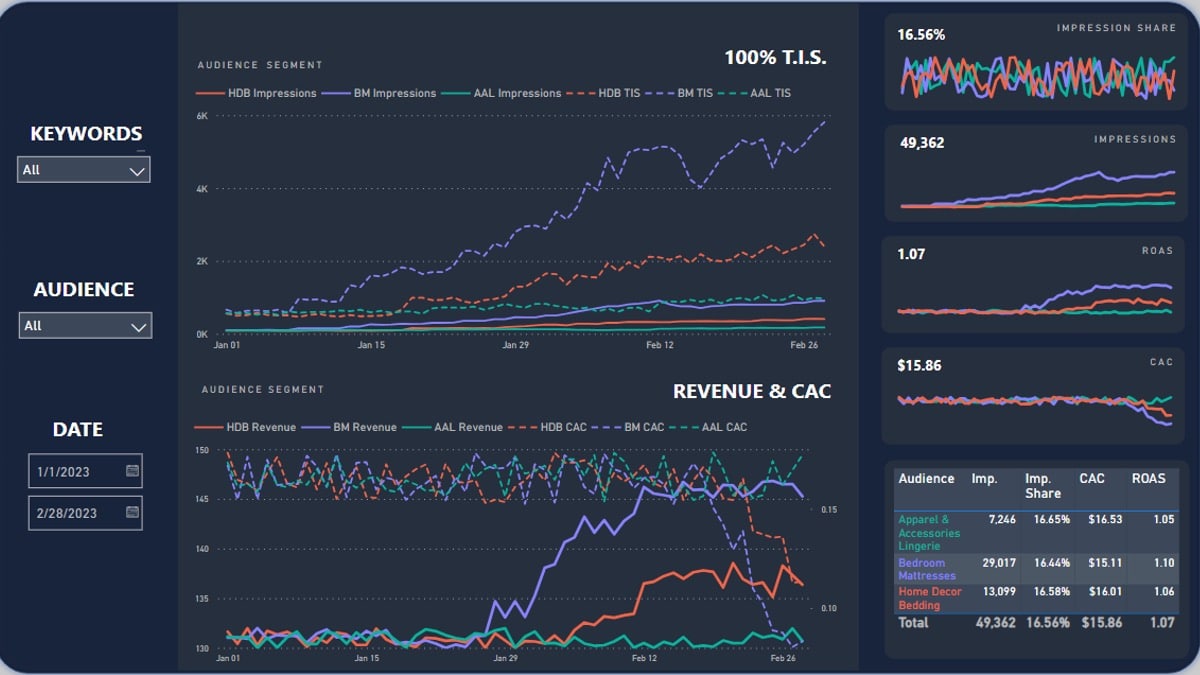
The dashed lines in upper center represent 100% TIS for brand keywords, colors denoting progress audiences of the same color lower right. You may correlate lift in this example with branding campaigns in any channels as well as trended direct site traffic. Power user tip: Study latency of branding campaigns’ push with trended 100% TIS.
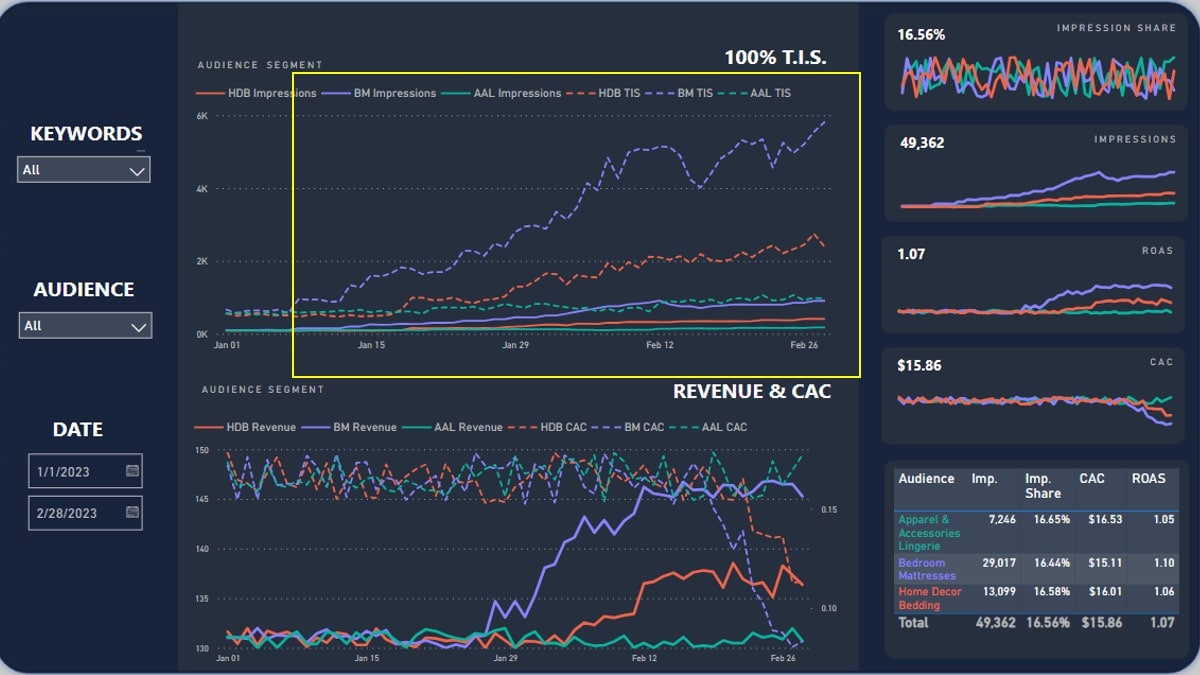
Next observe rising 100% TIS in the purple Bedroom and Mattresses category lower right along with total impressions purchased, impression share, CAC, and ROAS. In this visualization, center middle trends plot lines show correlation of Trended 100% TIS with Revenue and CAC. Upper right data shows average impression share among all audiences being studies, total impressions purchased, average ROAS and CAC. Brand keywords search volume in the orange audience, Home Décor Bedding psychographic segment are also lifted. There is little brand growth as represented by brand keyword search in the Apparel & Accessories Lingerie.
Considerations, Questions, and Ideas
- Make sure to wall off the test AdGroups from greater campaigns that may include the same keyword. Use various exclusion methods in the larger AdGroup containing the same keywords.
- Yippy Skippy to coordinate targeting of branding campaigns to AdGroups being measured by 100% TIS trends. In other words, one would expect that a branding campaign TO Bedroom Mattresses audiences resulted in lifted brand keyword search in- yep, the Bedroom Mattresses audience.
- How much impression share do we need to purchase to gain an accurate read? Great question. We’ll let you know as studies progress.
- 100% TIS techniques can work for concept, category, and subcategory keywords. For instance, we may study canoe trekking towboat informational searches from Minnesota from accessibility minded folks coinciding with whack job Montana vigilantes suing the US Forest Service in Federal Court to limit towboat usage. Ouch. Also observe subcategories like ski jacket searches as the climate changes, product categories when a brand is recalled, or any keyword in any Boolean audience definable in Google.
- What if there is not enough data? Good question. Not every keyword and/or in a defined geographic area has enough volume, especially with additional audience filters. You may have to expand keywords to those with more search frequency and/or relax audience definition.
You too can ride AIMCLEAR’s pony on acid. In 2024, consider measuring trended 100% Theoretical Impression Share for correlating branding investments with real cash money. Utilize tools from Google to study search frequency of keywords filtered by psychographic and demographic attributes in audiences.